

Cryo-ET data collection depends on making informed decisions for several critical parameters to optimize data quality and throughput. This chapter introduces common parameters of tilt-series collection to achieve a balance between maximizing signal and resolution while minimizing radiation damage and blurriness.
Electron microscopes require certain specifications for optimal tilt series collection, including a field emission gun (FEG) operating at 200 or 300 keV, a detector, a holder and/or stage cooled to cryogenic temperatures, and an energy filter for thick samples.
Cryo-ET tilt-series are often recorded of thicker samples than those for single-particle experiments. The use of stronger FEGs (e.g. 300 keV) increases the signal since electrons of higher energy can penetrate thicker samples. Direct electron detectors are preferred over other cameras because they offer substantially higher sensitivity and have a faster read-out capacity, thereby allowing for collection of movies with many frames per second rather than recording a single image. The recording of multiple frames enables correcting for beam-induced motion of objects, resulting in sharpened images (see Cryo-EM 101 Chapter 5). These modern technological advances, along with others described in greater detail in this chapter, have contributed to the stunning expansion of cryo-ET applications in recent years, including the visualization of macromolecules inside cells and determination of high-resolution structures by subtomogram averaging.
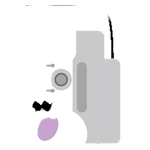
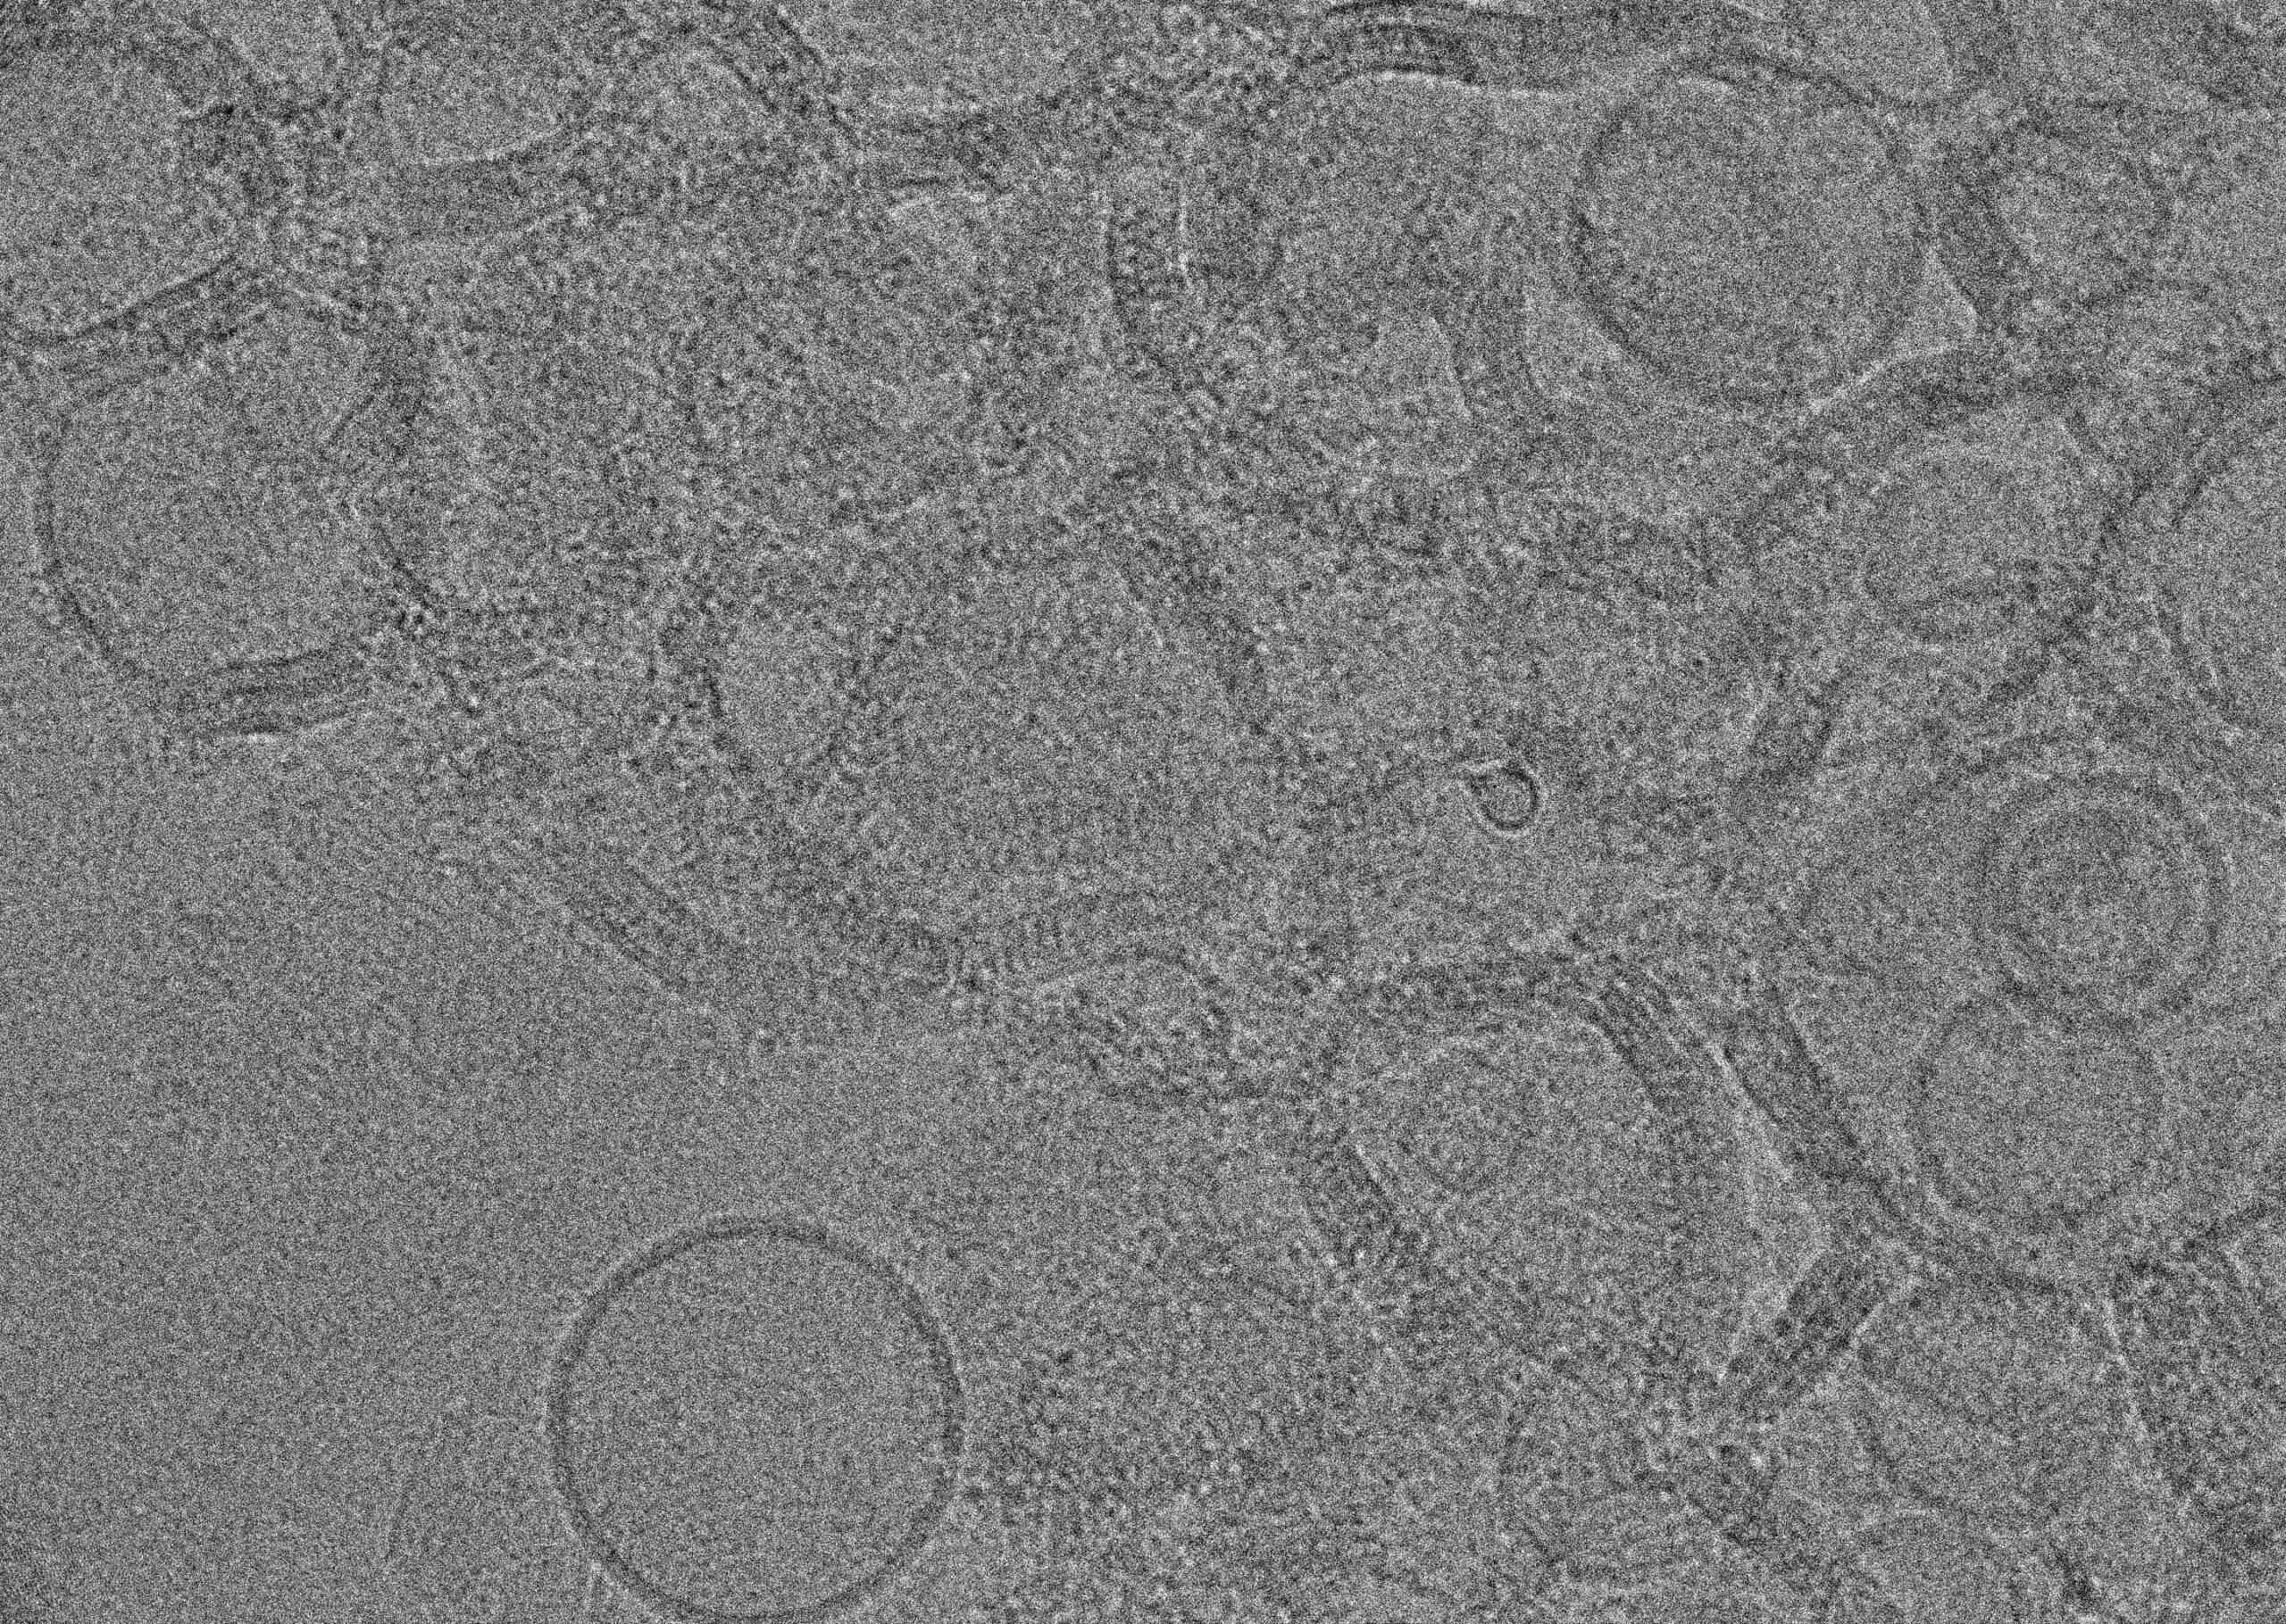
Energy filters are important hardware components for cryo-ET data collection. Their technology enables the removal, or filtering, of inelastically scattered electrons, which increases the contrast of images. This is especially needed for cryo-ET specimens, since these are generally thicker samples and the beam path through the specimen increases at higher tilt angles. When the electron beam penetrates the sample, some portion of the electrons are inelastically scattered due to random interactions with the atoms in the sample. As the specimen gets thicker, the path of the electrons increases as well, which increases the amount of inelastically scattered electrons. Consequently, the image appears blurry with reduced contrast.
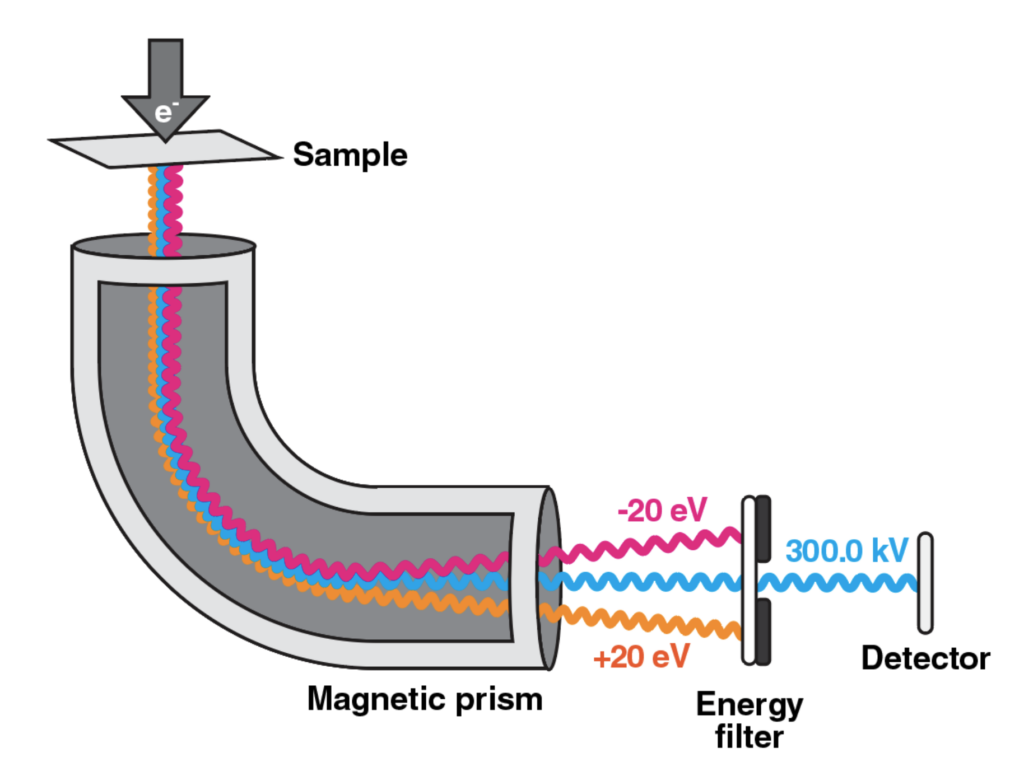
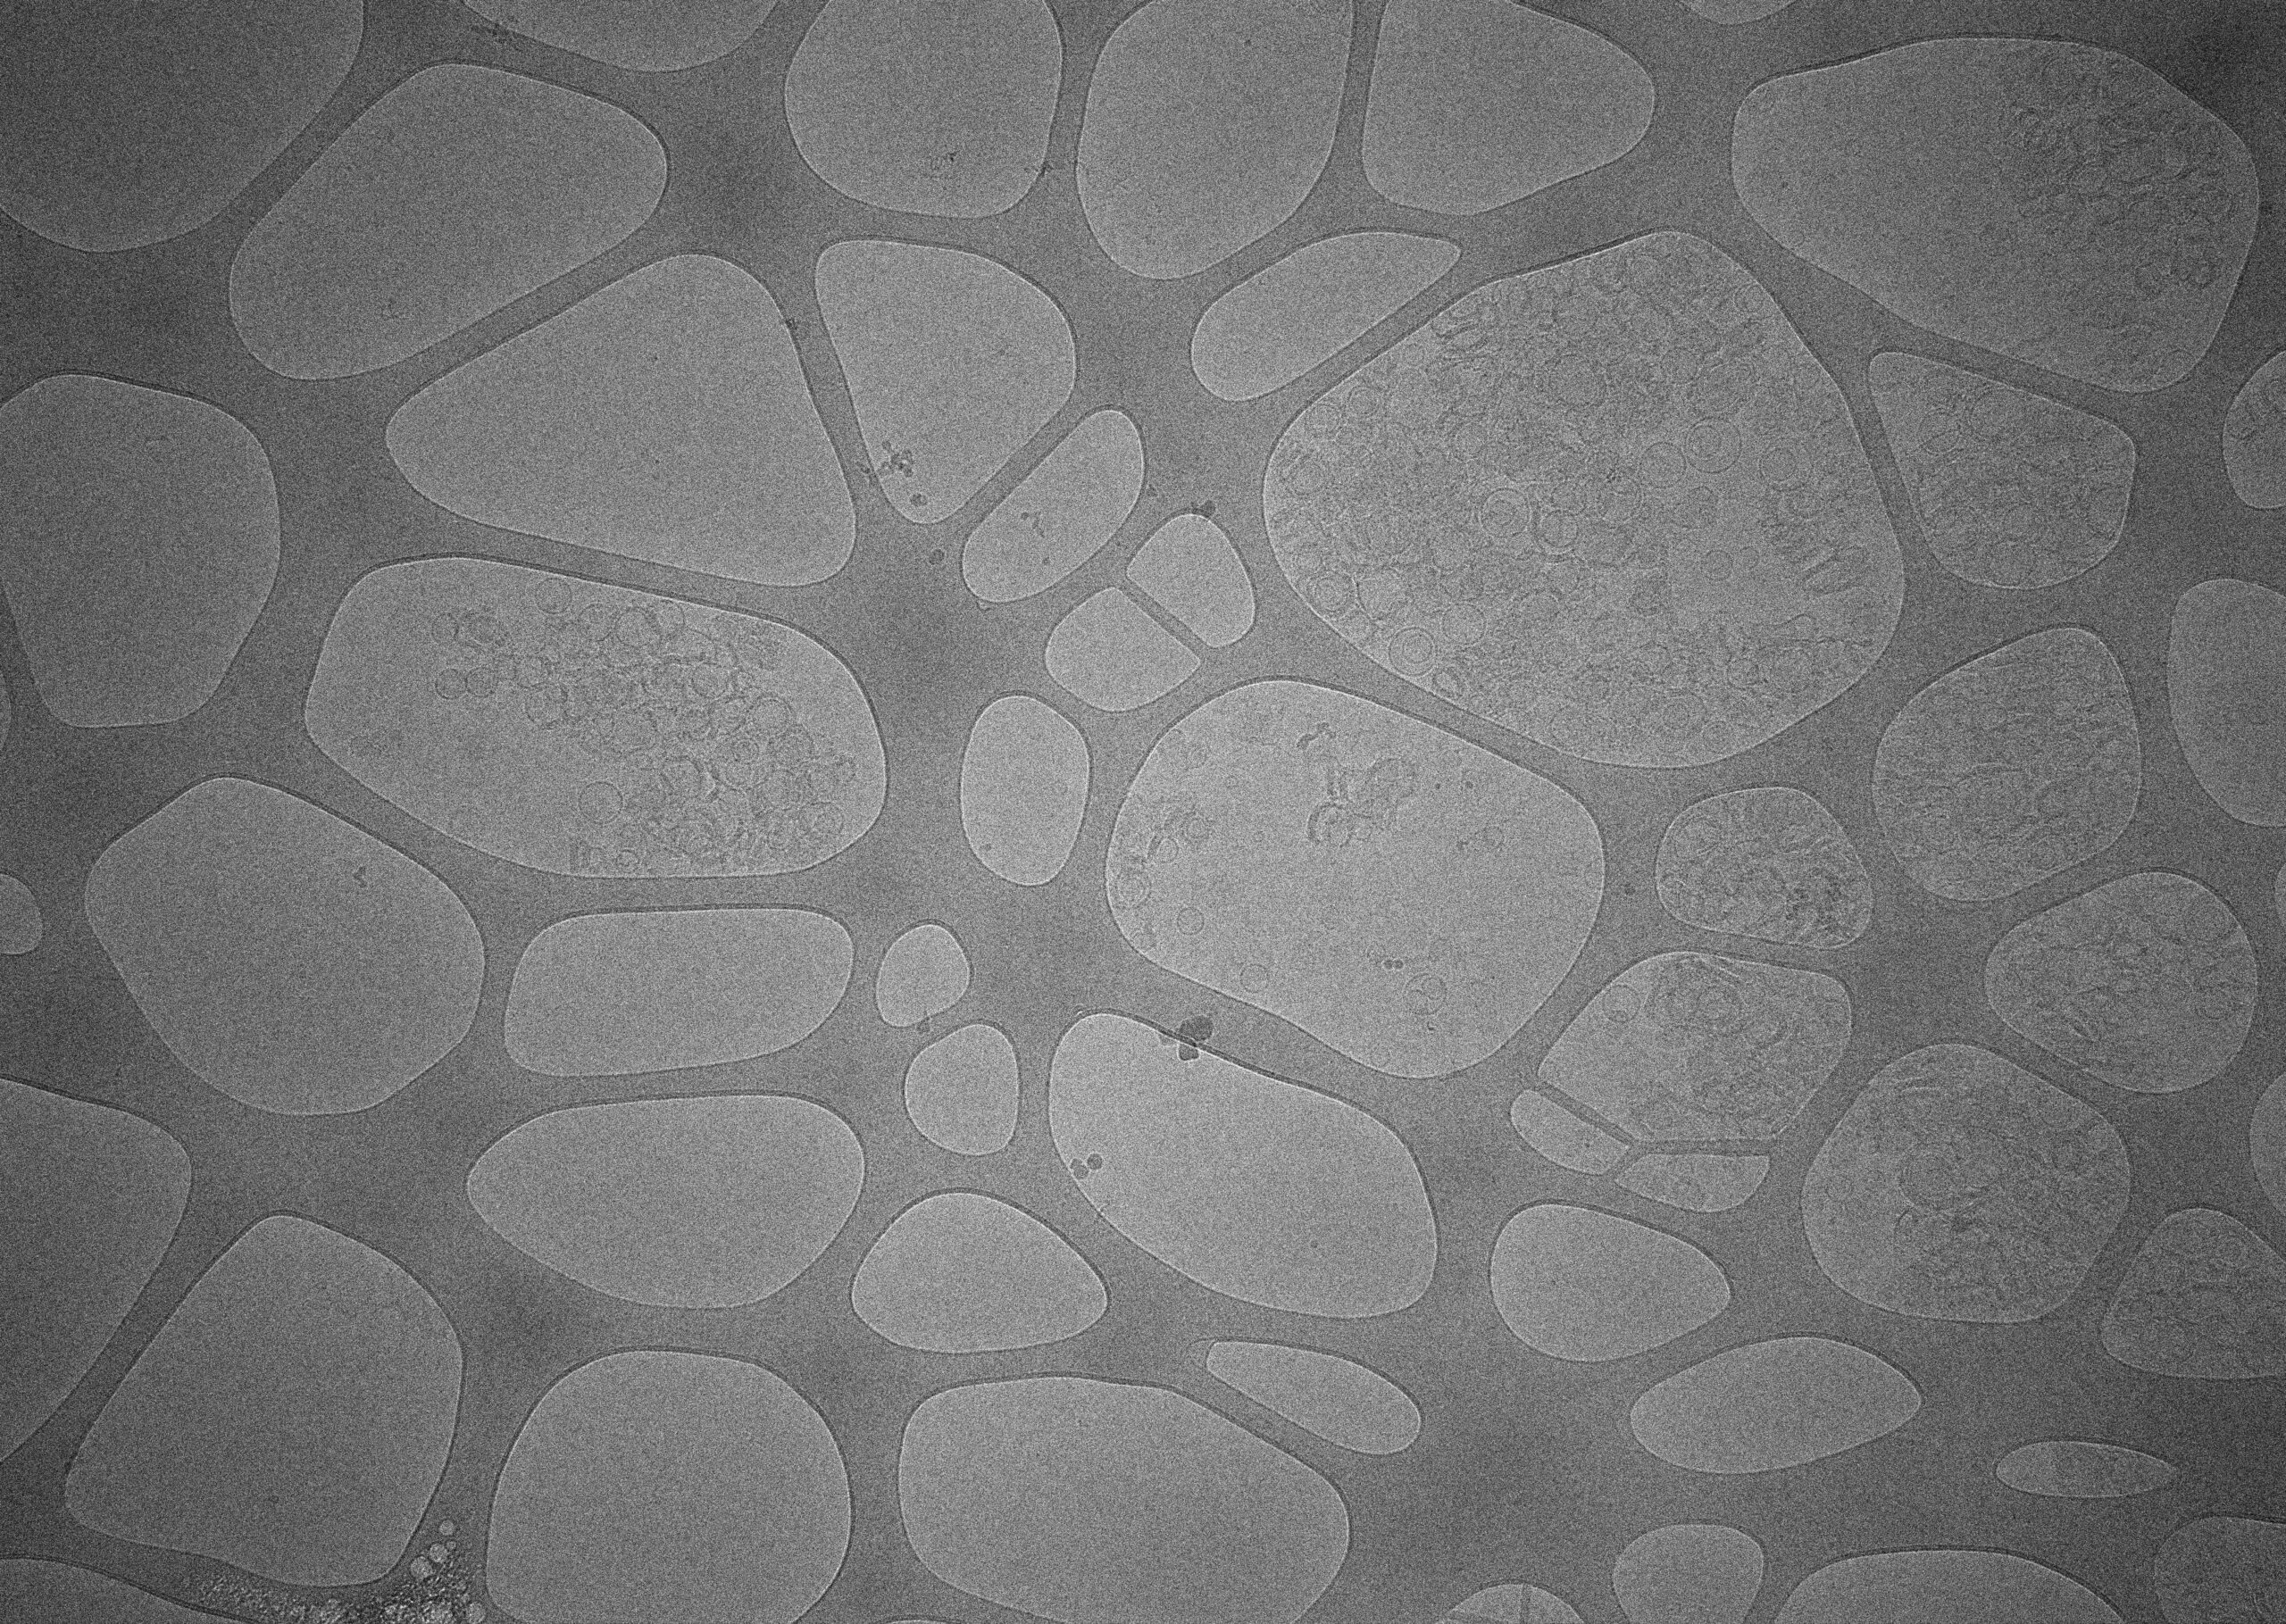
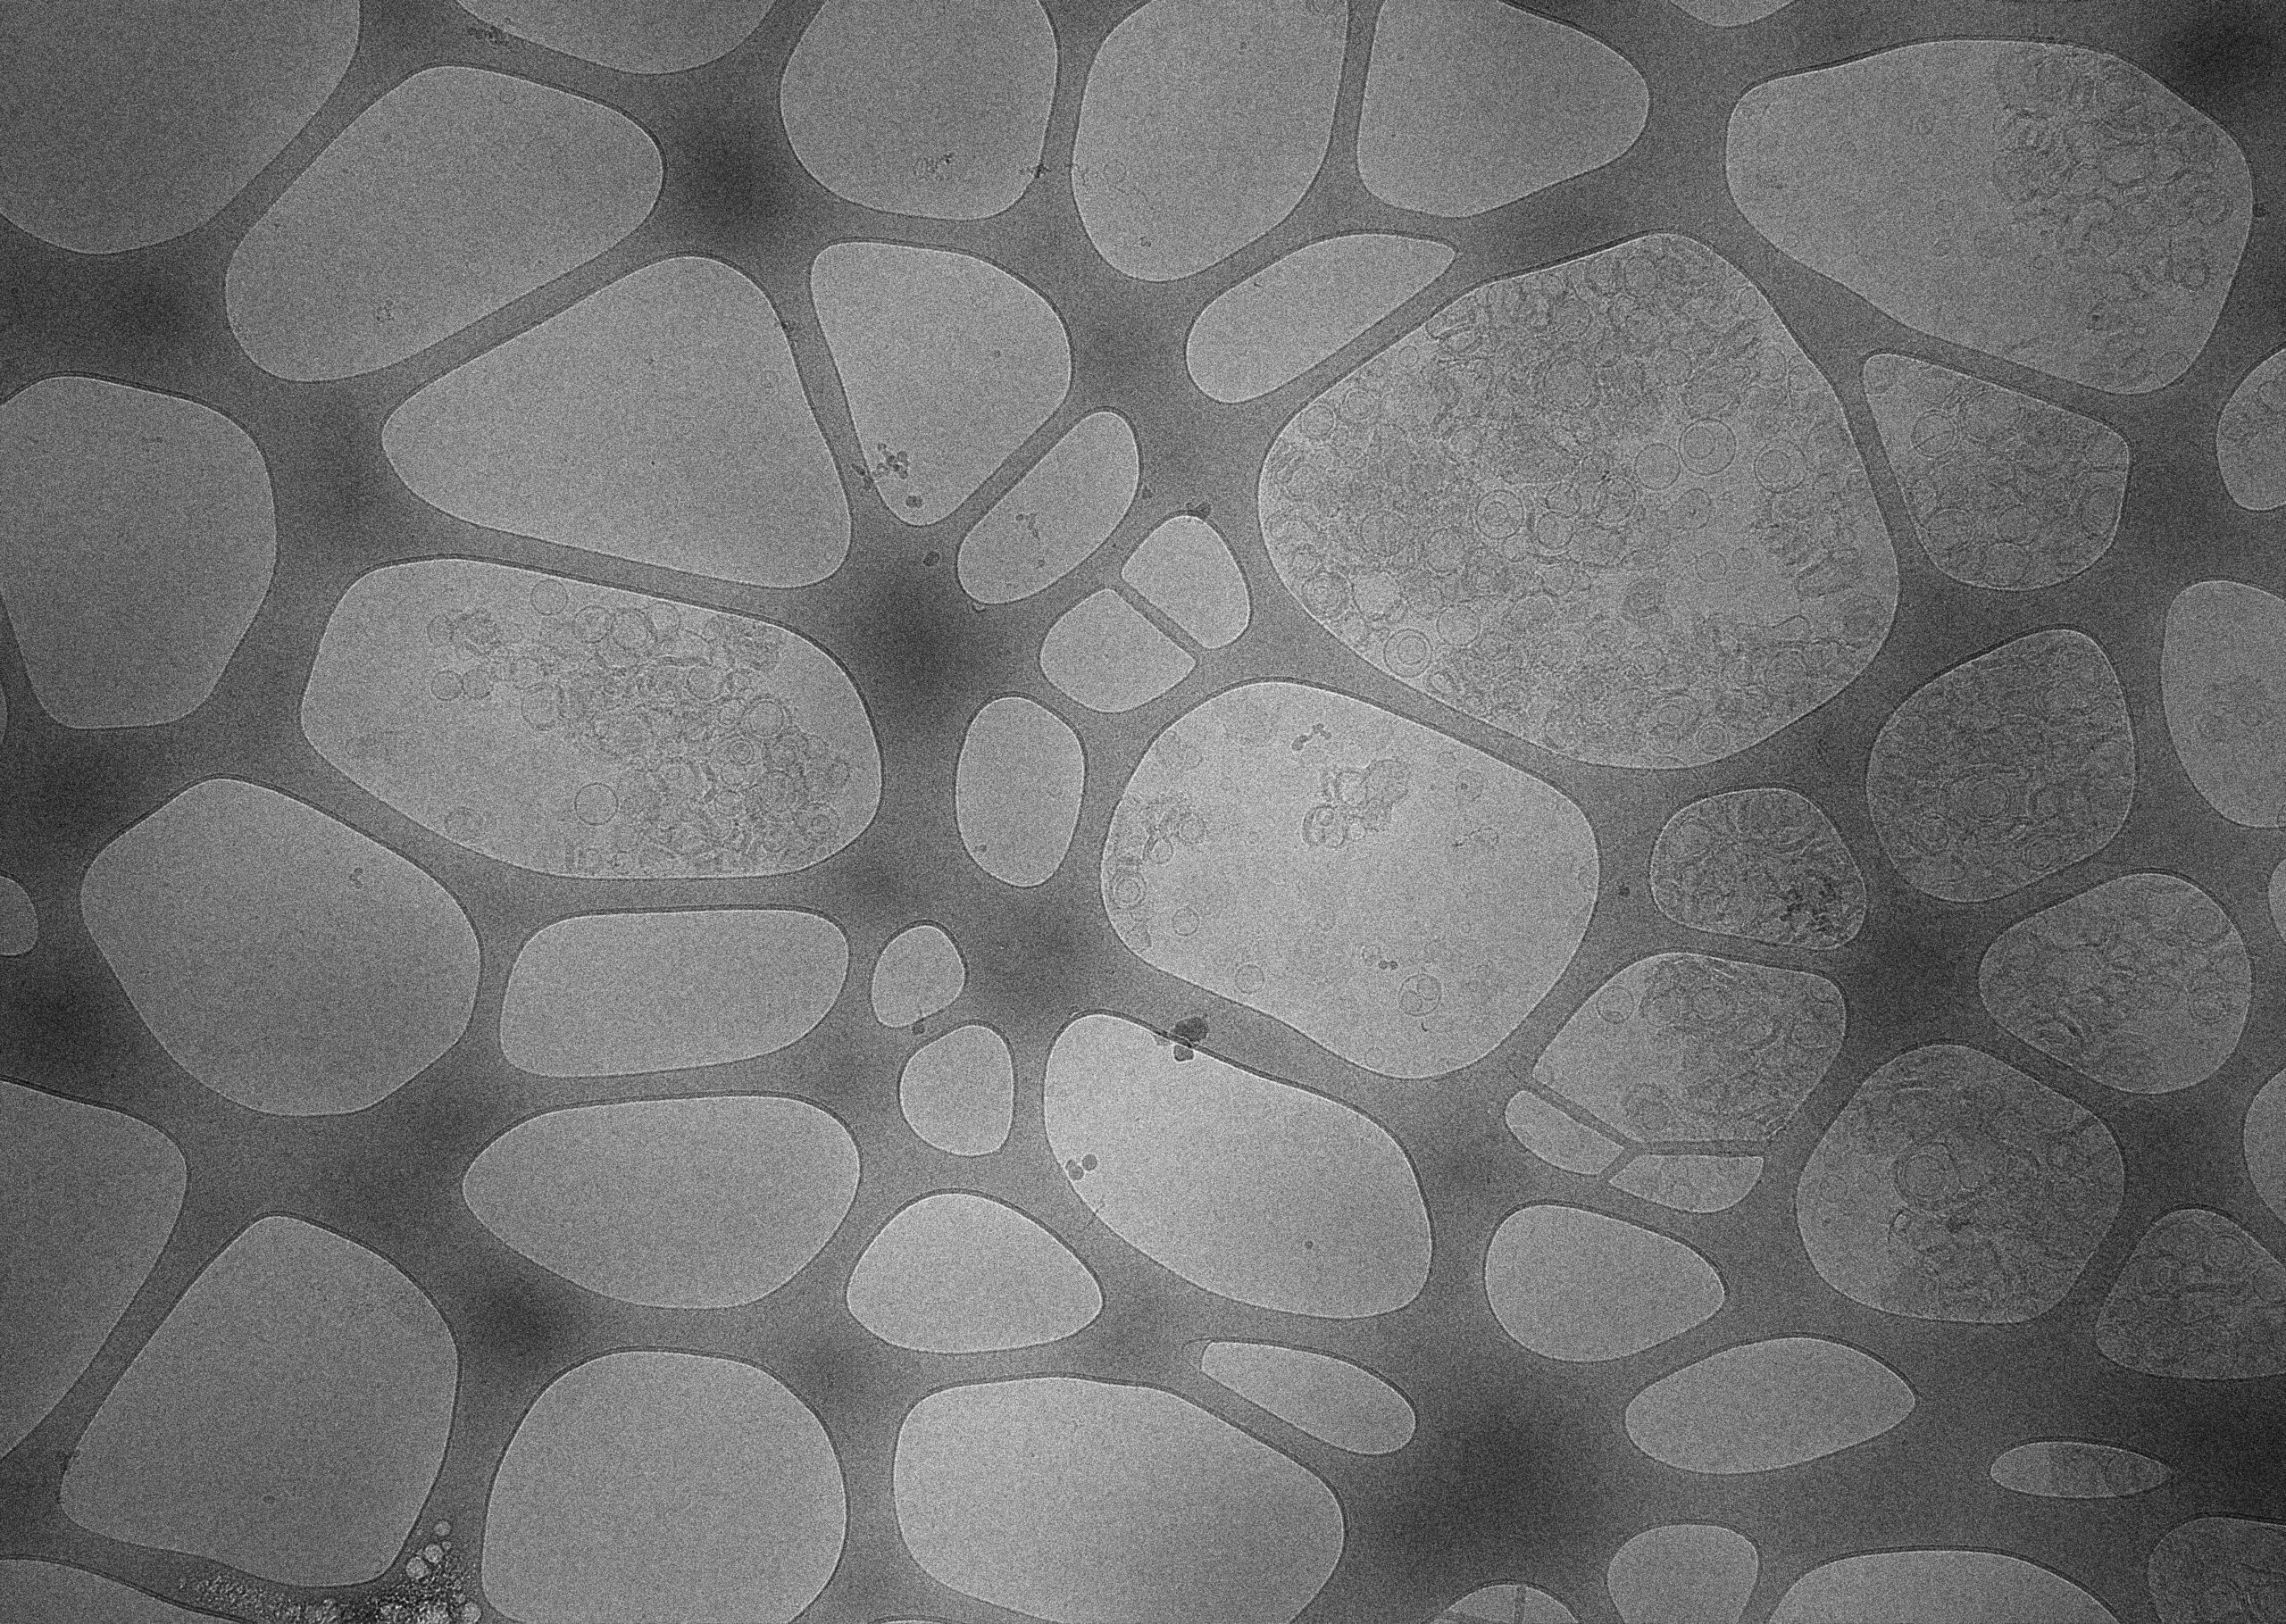
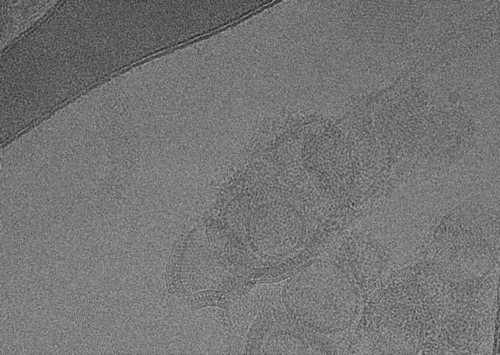
The use of an energy filter removes inelastically scattered electrons. The images shown here were recorded with and without an energy filter (20 eV slit). Note the differences in image contrast with the energy filter. At this lower magnification, the carbon substrate is easily discernible, and presence of liposomes is easily confirmed in both images. However, in images taken with the energy filter, differences in ice thickness become apparent (thicker ice towards the right, darker overall appearance). This provides valuable information that can be used to target regions with more desirable ice thickness.
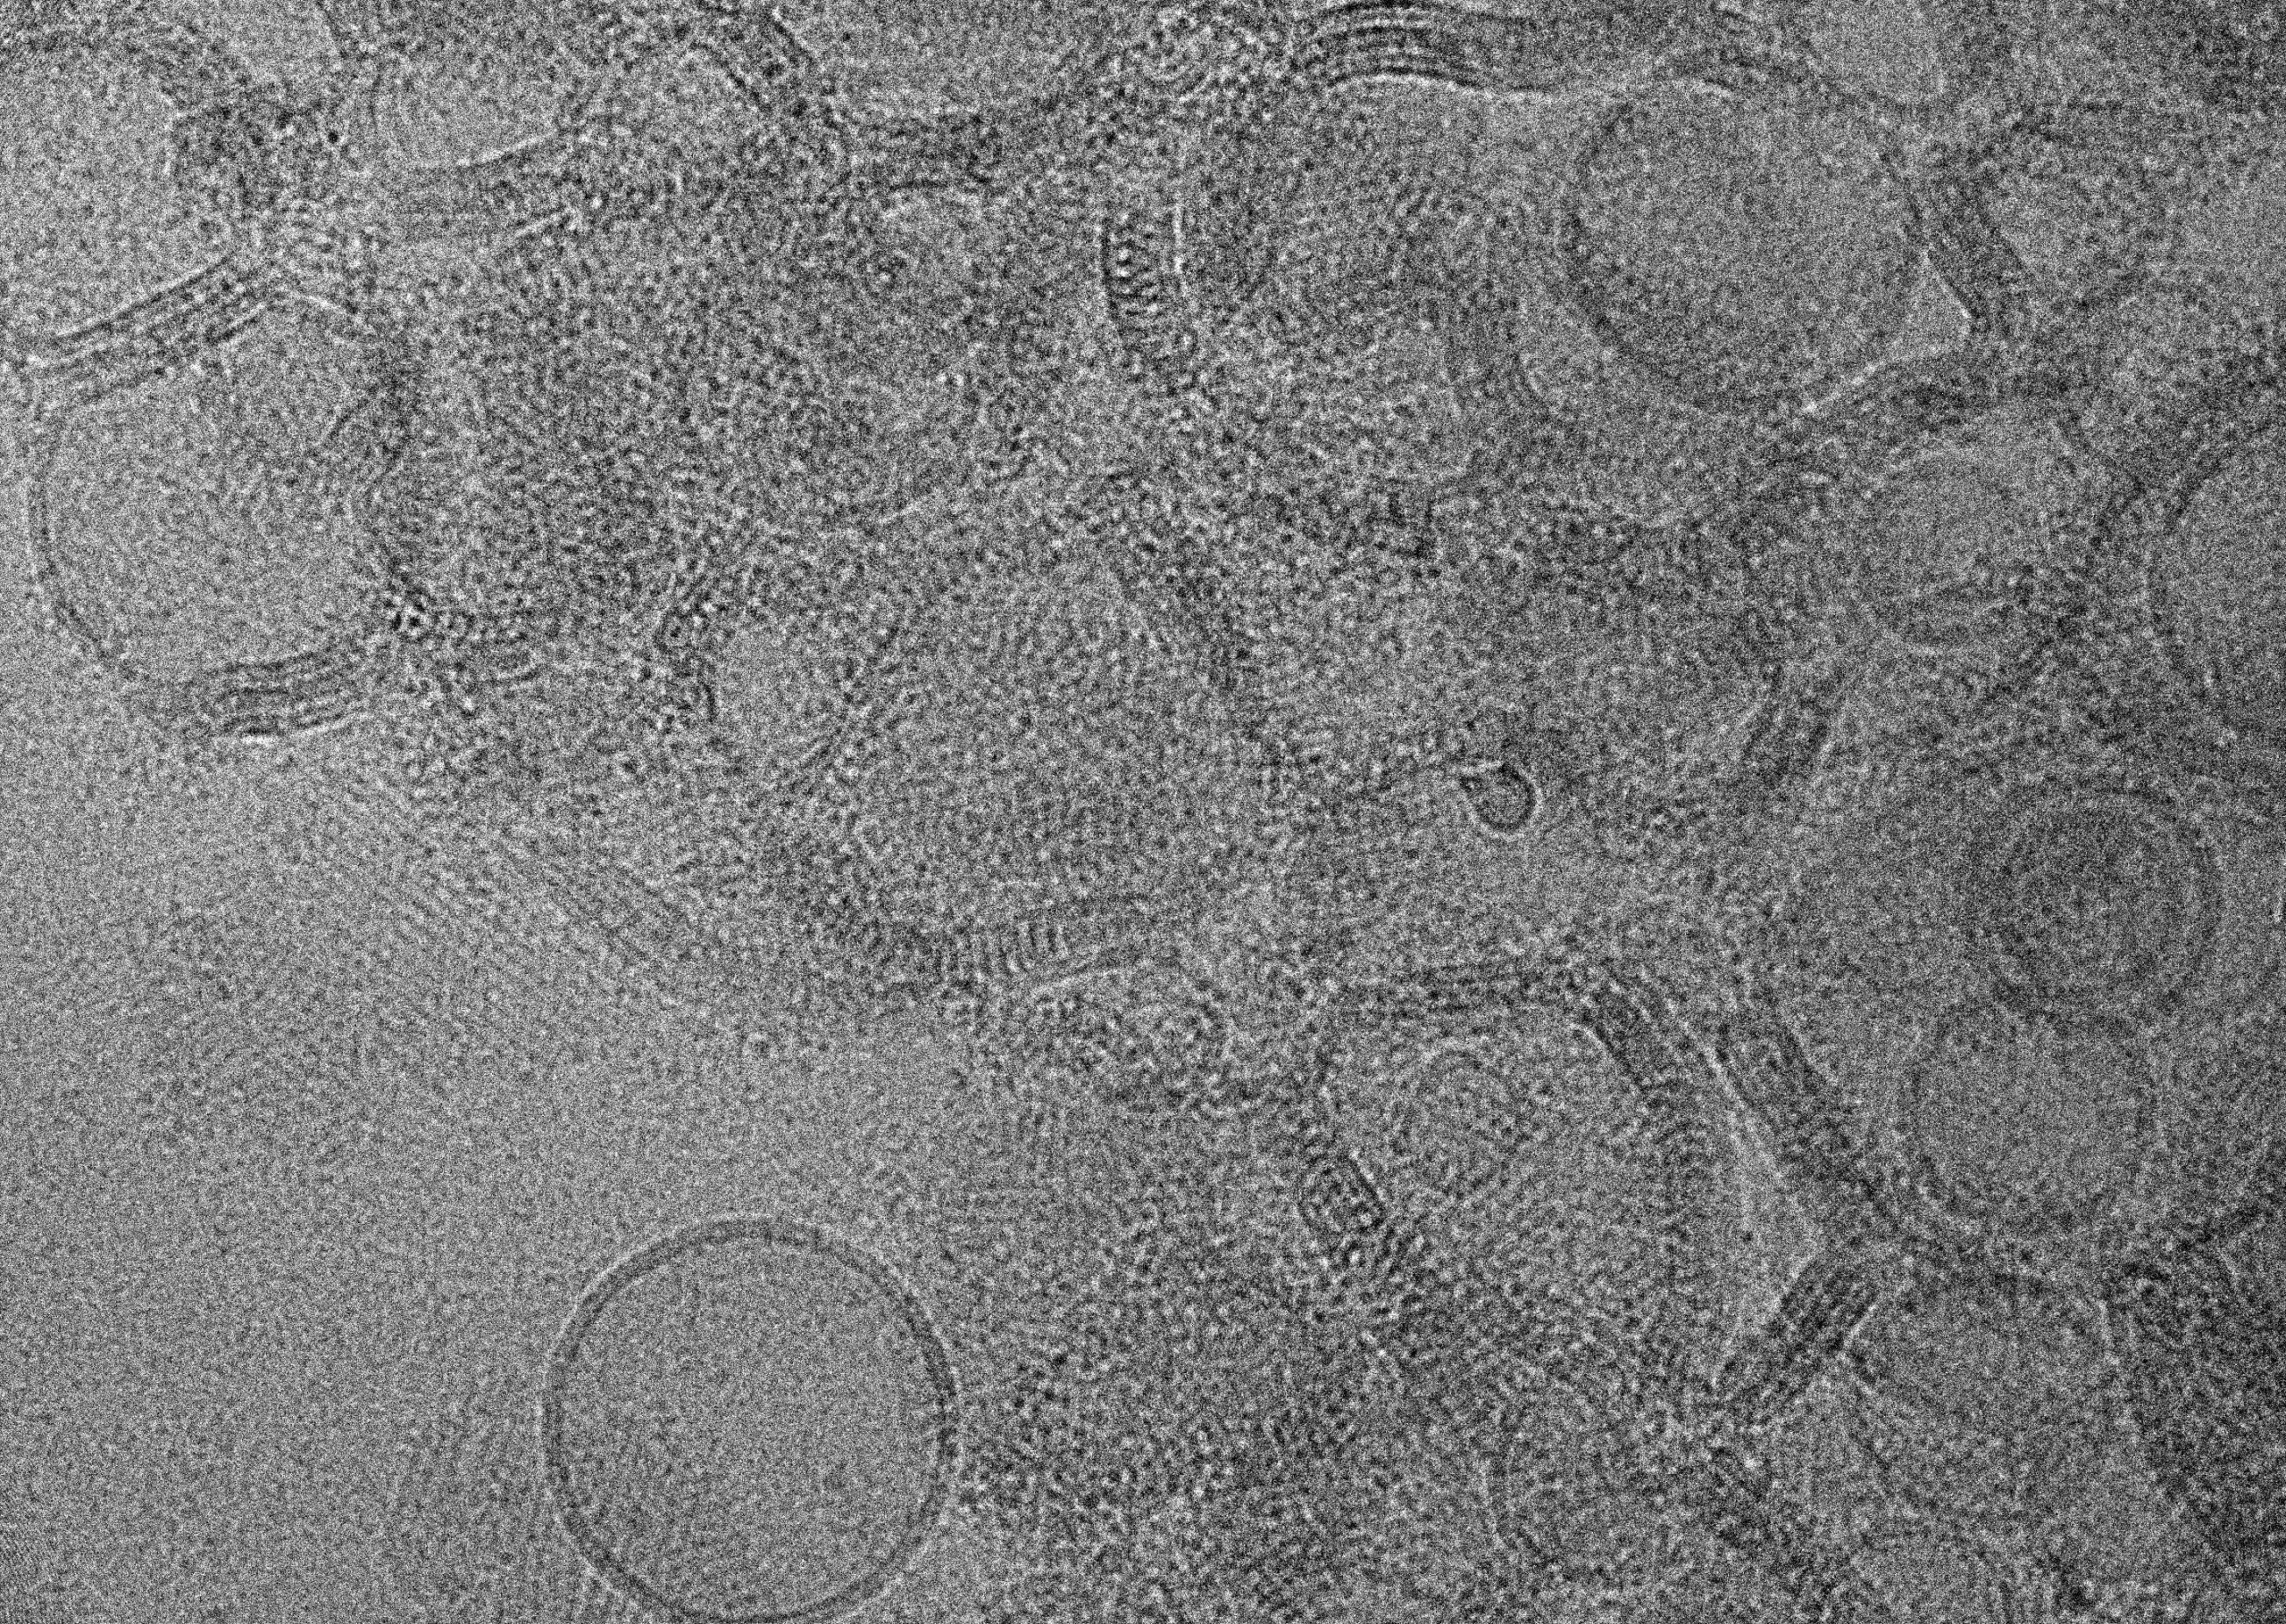
At a higher magnification, which corresponds to that of exposure, focus, and tracking images, the effect of the energy filter are drastic: lipid bilayers of the liposomes and protein detail are easily recognizable – especially in areas, where many liposomes are stacked on top of each other in an aggregate (top right); note that the protein detail is nearly unrecognizable without an energy filter. Additionally, ordered lattices appear on the bottom left and middle with recognizable features only in images taken with the energy filter inserted.
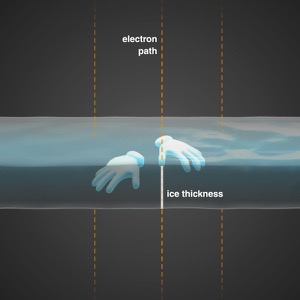
The sample thickness is also a major consideration because samples inherently become thicker when imaging at increasingly high tilt angles. The ice is thinnest at 0° and increases proportionally with higher tilt angles.
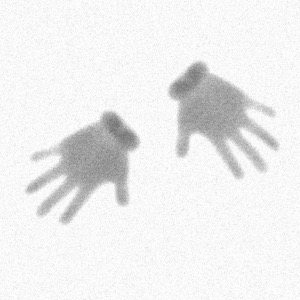
The impact of thicker ice on image contrast and detail becomes apparent in this interactive module. Note how the ice is thin at low tilts, and features are discernible in high detail. As the tilt angle increases, image contrast is reduced by the thicker ice and features become more blurry, leading to less discernible edges and shapes.
When the sample thickness increases, fewer elastic electrons are able to penetrate the sample and detail and high-resolution features become lost. A simple solution would be to increase the electron dose during exposure, but in practice the total dose is limited since biological specimens are very susceptible to radiation damage caused by inelastically scattered electrons. When electrons penetrate the sample some are interacting with the biological material and are inelastically scattered which blurs the image. This can at least be combatted to some extent with the use of an energy filter. However, once the thickness increases too much the necessary resolution is lost and proper data acquisition, alignment, and processing of the data will no longer be feasible.
When selecting a tilt range, sample thickness also needs to be taken into consideration. Current stages on microscopes are limited to a range of +/- 70 degrees. Thin samples can be tilted within the available range while still allowing electrons through. Imaging may not be helpful at the highest tilt angles due to loss of contrast caused by increased sample thickness. In fact, pushing to extreme tilt angles results in too little contrast and one may risk losing the tilt-series altogether if the position of the specimen can no longer be tracked.
Thicker samples may result in very blurry projections that do not contain sufficient detail during alignment, so a range with lower tilt angle limits (e.g., +/- 55 degrees) might be beneficial, though issues with the missing wedge will become more apparent.
During data collection, the same region of the grid is recorded at different angles. The images then become compiled and aligned to produce a tilt-series which shows the different views of the region. Since the angular information is known, the information contained in the tilt-series can be used to reconstruct a 3D volume. Ideally, to obtain a perfect 3D volume, images of 360 degrees would be collected at infinitely small angular increments. However, the combination of mechanical limitations of the stage, the sample thickness increasing with higher tilts, and accumulating radiation damage during imaging, only allow collections from a practical maximum of +70 to -70 degrees with increments of a few degrees per image. Cryo-ET becomes an art of striking a balance between highest signal to noise ratios while minimizing damage of the sample. The following parameters and collection strategies should be considered to optimize data collection. Similar to sample preparation, the parameters need to be optimized for each experiment depending on the goals of the project.
The cumulative dose that the sample receives during the tilt-series acquisition is referred to as the total dose. Overall, a higher total dose will improve signal-to-noise ratios and provide better contrast during data processing steps such as alignment and reconstruction. However, increasing dose comes at the expense of increasing radiation damage. Radiation damage may lead to features-of-interest becoming destroyed and introduce increasing noise in images. When the sample is irradiated during tilt-series acquisition, the resolution of the 3D volume after reconstruction will also become limited. Therefore, it is important to use a total dose that generates sufficient contrast for processing and analysis while minimizing the radiation damage on the sample and keeping the features of interest intact.
The total dose is especially important for subtomogram averaging applications that aim to achieve molecular to atomic resolutions and needs to be determined for each sample. For applications focused on larger structures and membranes, a higher total dose can be considered since contrast is more important than retention of high-resolution features.
Typical total doses for cryo-ET applications range between 40-120 e-/Å2. To determine the optimal dose for a data collection, a ‘burn test’ at a representative region of interest will be conducted. The region is exposed incrementally to electrons and at each step, an image is taken - similar to what you would observe at the electron dose module below. The features and details of interest are monitored after each exposure to determine the highest dose the sample can tolerate before too much damage occurs. Often this point correlates with the last few exposures taken before bubbles appear, which determines the total dose used during tilt-series acquisition. Note that high-resolution features such as protein side chains and secondary structures will become destroyed at much lower electron doses.
We have captured images of liposomes coated with proteins in 5 e-/Å2 increments until a total dose of 600 e-/Å2 was reached. Use the slider to advance through the image series. Note that protein features are lost first within the first few exposures (70 e-/Å2) and even membranes appear to melt shortly after. Bubbles in the sample appear in higher dose images (200 e-/Å2), where protein and membrane features are already lost, and they often appear first on carbon and later within the sample (see below 70 e-/Å2 for carbon, 200 e-/Å2 for sample).
The angular increment determines the angle the sample is rotated between image acquisitions, while the tilt range defines the angles the sample is tilted during data collection. Both are important parameters to consider since they directly affect the quality, completeness and, hence, resolution of the 3D reconstructions. For example, a tilt-series can be collected with a tilt range of 60 and -60 degrees in increments of three degrees.
The wider the tilt range the better is the coverage of the sample, which in turn leads to higher resolution, completeness and structural detail in the 3D reconstruction. However, due to stage limitations and increasingly thicker specimens at higher tilts, in cryo-ET the tilt range cannot exceed 70 degrees, and often are collected in the range of +60 to -60 degrees. However, one has to remember that a larger tilt range will increase the number of images to be taken, which will require a reduction of dose/image and the time it takes to do so, which may be less beneficial than less coverage.
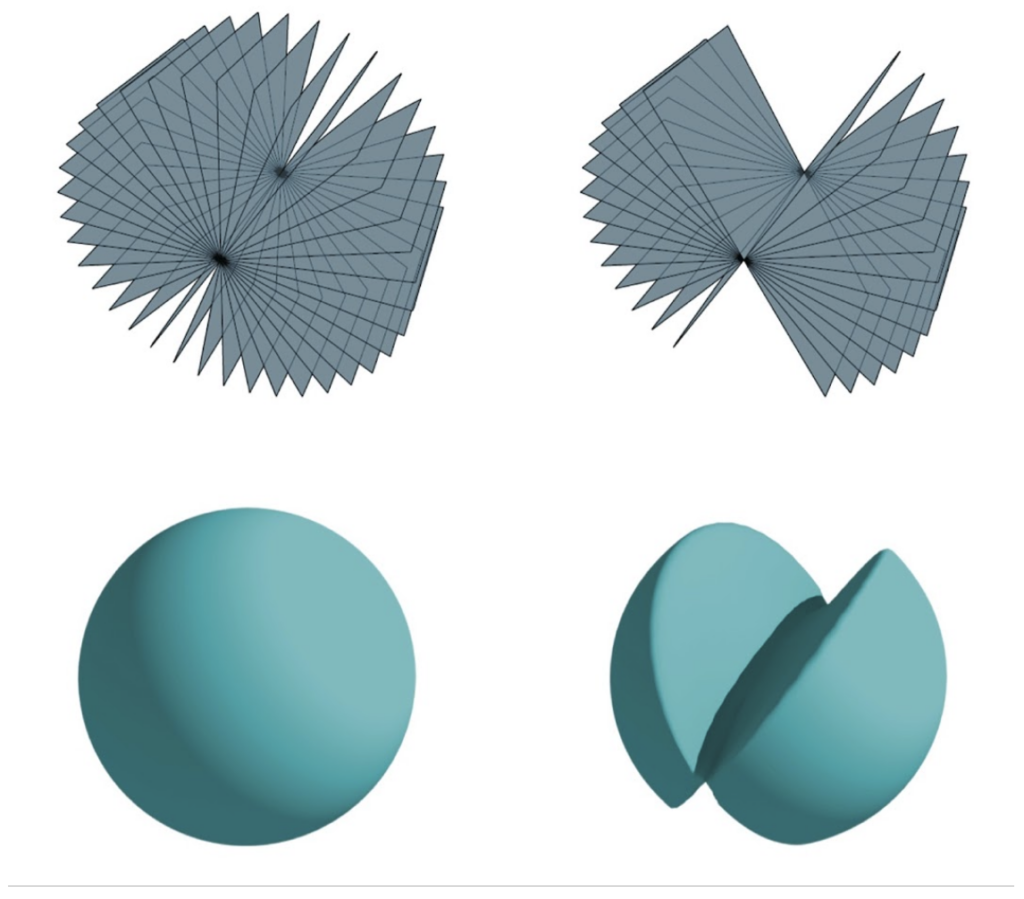
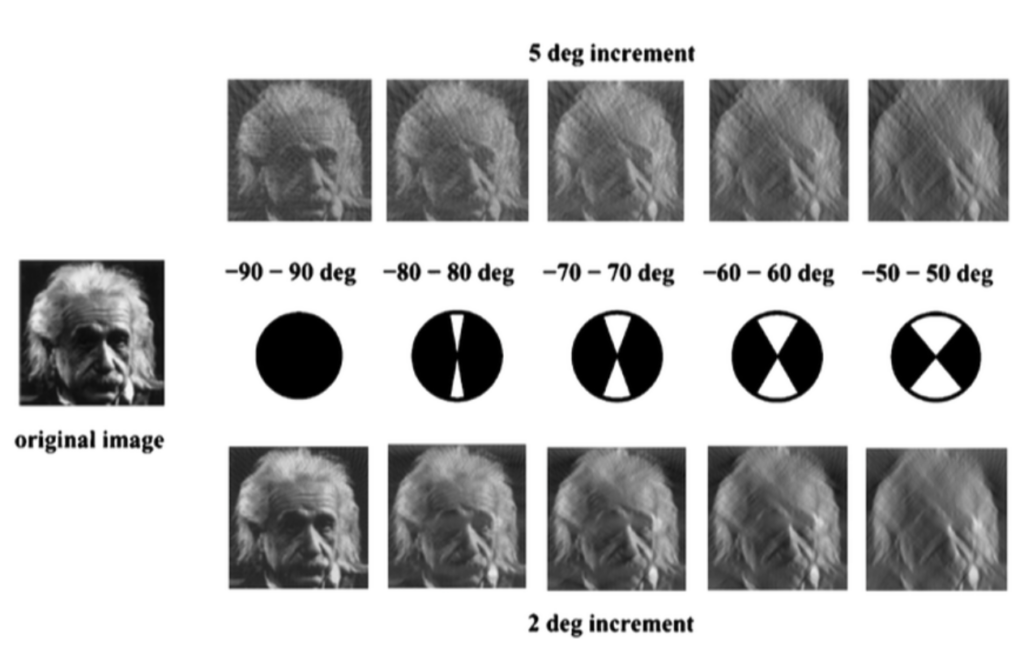
The limited tilt range directly underlies the ‘missing wedge’, which is caused by missing projections of the sample region. This region is inaccessible since the sample is not penetrable exceeding 70 degrees tilt. So, stage limitations and increased sample thickness create a wedge-shaped gap in the final 3D reconstruction. The lack of data due to the missing projections has a severe effect: distortions in the reconstruction become apparent, causing artifacts in 3D reconstructions. In the direction of the missing wedge, streaking appears: features are elongated and sometimes make two objects that are in close proximity to each other appear connected due to missing information.
The smaller the tilt increment, the more images need to be recorded in a tilt-series. More images will provide higher coverage of the sample increasing data completeness. Streaking and elongation of features are reduced with smaller increments, and consecutive tilts are likely to have more overlap improving refinement procedures and ultimately resolution. The dose per image will be smaller to accommodate collection of more images while maintaining the total dose. More images to be collected will increase the time per tilt-series collection. In contrast, too large tilt-increments will provide less sampling, use more dose per image, and use less microscope time but produce artifacts in the reconstructions.
Although higher tilt ranges and angles are desirable, it is important to strike a balance between better sampling, data collection time, and total dose which all directly will affect the quality and resolution of the final 3D reconstruction.
The magnification used for data collection dictates the pixel size of the image and therefore the physical resolution limit. An optimal magnification will strike a balance between capturing features-of-interest within the field-of-view of the detector and the achievable resolution. High magnifications will produce images with fine pixel sizes, but will reduce the area captured within the field-of-view. In contrast, low magnifications will produce images with coarse pixel sizes and place physical limitations on the achievable resolution due to the “Nyquist limit”.
The “Nyquist limit” is a term commonly used among TEM practitioners to refer to the maximal achievable resolution from a dataset. The term is derived from the “Nyquist-Shannon sampling theorem”, which in the context of cryo-EM/ET imaging refers to the maximum theoretical resolution imposed by the pixel size. The Nyquist limit simply refers to twice the pixel size, e.g. images recorded at 1.0 Å per pixel have a physical limit of achieving 2.0 Å resolution. In practice, achievable resolutions are generally considered to fall short of Nyquist due to the dampening of high-resolution signal from hardware limitations.
Modern day detectors have capabilities to record in “super-resolution” modes that enable subpixel localization of electron events, and therefore allows the Nyquist limit to be surpassed. In practice, the benefits of recording cryo-ET in super-resolution mode do not appear to be significant and this mode is generally discouraged. Generally, pixel sizes of ~4.5 Å are sufficient for segmentations and subtomogram averaging (~ 20-10 Å resolution), and ~2 Å for subtomogram averaging approaches (~ 4-9 Å resolution).
Phase contrast in TEM images is generated by applying a mild amount of defocus during image acquisition. An optimal defocus range will balance between retaining high-resolution information and generating sufficient contrast to identify imaged features. If the micrograph is too close to focus, then features may be invisible. If the micrograph is too far from focus, then there will be an attenuation of high-resolution information. Smaller features may require higher defocus settings to generate sufficient contrast. Cryo-ET tilt series are typically collected with defocus values ranging between -1.5 and 5 μm, especially if subtomogram averaging is the ultimate goal. A range of defocus settings is used so that the dataset contains maximum information across Fourier space. However, higher defocus settings can be applied if features-of-interest are difficult to see or segmentation is needed to highlight different features in a cellular environment. Note, that during data collection, one side of the image is usually at different defocus in comparison to the other side of the sample, since the sample is physically tilted during the collection resulting in a defocus gradient. Images collected at tilted angles will contain a defocus gradient. Therefore, defocus values need to be estimated throughout the image to maximize the quality of the CTF correction.
The tilt-scheme determines the angles and the order the images are collected in and there are three common tilt-schemes: continuous, bidirectional, and dose-symmetric. The consideration of different tilt-schemes is to optimize the data collection while preserving high resolution features, especially when subsequent subtomogram averaging approaches are intended. The sample decays as the dose increases and the sample will look different at high and low tilt angles, which will change the image appearance and can interfere with tilt-series alignment and reconstruction.
When using the continuous tilt-scheme, the highest tilt angle will be collected first and the subsequent images will be collected in small increments until the highest tilt angle at the other side is reached. The effects of using different tilt-schemes on resolution can be shown by the example below depicting Fourier planes. Fourier planes can be used to visualize the frequencies captured within each image: the longer the line, the higher the resolution content. High frequencies allowing high resolution information to be obtained are towards the tips of each line, while low frequencies are reflected in the center giving rise to low resolution features. When looking at the first and last fourier planes, it is noticeable that the lines become shorter as the collection proceeds and the total dose accumulates.
When using the bidirectional tilt-scheme, data collection will begin at low tilt angles favoring collection obtaining high frequency information (long lines) when the ice is the thinnest. Then data is collected until the highest tilt angle is reached and the sample is returned to 0° tilt. Next, the other half of the tilt-series is recorded until the highest tilt angle is reached on the other side. However, there are practical concerns upon return to 0° tilt: the second half of the tilt series has been already damaged through the accumulated dose (note the shorter lines in the second half of the video). This makes the sample appear quite different in the latter half, and if the differences are too drastic, the tracking software may be unable to find its way back to the same region when returning from high tilts. In addition, during alignment, it might be that the first images between the first and second halves look quite different due to sample movement and radiation damage, which may interfere with tilt-series alignment. To capture most of the high frequencies at thin ice, the data collection can also begin at +21° and then sweep through to the high tilt-angles.
When using the dose-symmetric tilt-scheme, data collection takes advantage of preserving high-resolution information in the thinnest ice by beginning at 0° and oscillating back and forth like a see-saw between positive and negative angles (e.g. 0°, 3°, 6°, -3°, -6°, -9°, -12°, +9°, +12°, [...] ) until high tilts are reached. This method will give a symmetric distribution of dose and most of the high frequency information is now obtained at thin ice before the signal is lost at higher tilt-angles. Another benefit of this tilt-scheme is that tilt-series alignment should not be hampered because neighboring images had a similar overall dose exposure, and, in case high tilt images have been compromised too much by the electron dose, they can be easily removed without disrupting the tilt-series flow like it would in tilt-series collected using the bidirectional tilt-scheme.
Overall, when the microscope stage is stable and favorably also equipped with an energy filter, the dose-symmetric tilt-scheme is the most widely used scheme for tilt-series collection. If there are stage issues that the sample cannot be easily tilted back and forth without extended settling times or with likelihood of loss of the region of interest, the bidirectional tilt-scheme is still good to use. Both, dose-symmetric and bidirectional tilt-schemes recover the signal better and are hence favorable over the continuous method. Preserving as much of the high frequency information as possible is desirable, since the order we collect the images in will have a direct effect on the quality of the 3D reconstruction.
For more detailed information of tilt-schemes please see the article by Dr. Wim Hagen and colleagues J. Struct. Biol. (2017).
Once the sample is loaded in the microscope, the data collection can begin. First, the eucentric height needs to be determined before an atlas of the grid can be taken and higher magnification montages of grid-squares can be prepared. Ideally, the grid is placed at eucentric height, where the focus and grid planes intersect.
It is important the sample lies at eucentric height, so that it remains in the center of the images across all tilt angles. This will minimize the region of interest from lateral movements during data collection. It is important to note that due to increased sample thickness in cryo-ET in comparison to single-particle cryo-EM approaches, the defocus within a sample can vary (see above Defocus), so some regions will be at perfect height and stay centered, while others will move. The region of interest should be located at the center of the exposure region.
Once a square montage has been collected, a ‘burn test’ is conducted at the same magnification as the images that will be collected during tilt-series data collection, to determine the total dose. (See Electron Dose module). The defocus is set to -5 to -8 µm to allow for high contrast and the region is exposed to the electron beam in 5 e-/Å2 increments. Once loss of definition is observed, the total dose is reduced by 5-10 e-/Å2 and used as total dose for tilt-series collection.
The tilt-series collection can begin. It is divided into four steps, which are comprised of setting the tilt-angle, tracking to identify the correct region, focusing, and ultimately, recording an image. Focus, targeting and exposure are taken at the same magnification to minimize error and the focus/tracking region are ideally placed onto carbon at the same location. These four steps are repeated until the entire tilt-series is collected. Severe damage will occur to the tracking and focus region, since it will be exposed to more electrons.
Once a tilt-series has been obtained, a new region of interest can be recorded. Depending on collection scheme, angles, and increment, more than fifty tilt-series can be captured during a 24 hour data collection period. Some data collection softwares (e.g. SerialEM, Tomo5, etc.) allow for exposure selection on square level and subsequent tilt-series are collected without supervision.
*Section content contributed by Dr. Jae Yang, Dr. Bryan Sibert, and Dr. Elizabeth Wright (Wright Lab).
Lamella are milled at an angle in the FIB/SEM, which has an impact on the data collection strategy (see Chapter 3). Since the lamella lies at an angle and is milled in a predetermined direction, grids with lamella need to be loaded in a set orientation to have the lamella at the correct position in the electron microscope on the tilt-axis. Since lamella were milled at an angle, an additional tilt is needed, because the lamella at 0 degree tilt will not lie flat.
First, the grid has to be loaded in a predetermined orientation. The milling slot needs to lie either left or right (not top or bottom). To help with identifying the position of the milling slot under nitrogen prior loading, the Autogrids can be marked with a sharpie on the opposite side of the milling slot to aid visibility. The grids are then loaded in the cassette and into a high end microscope (see CryoEM 101 Chapter 4 for loading of grids into a Titan Krios).
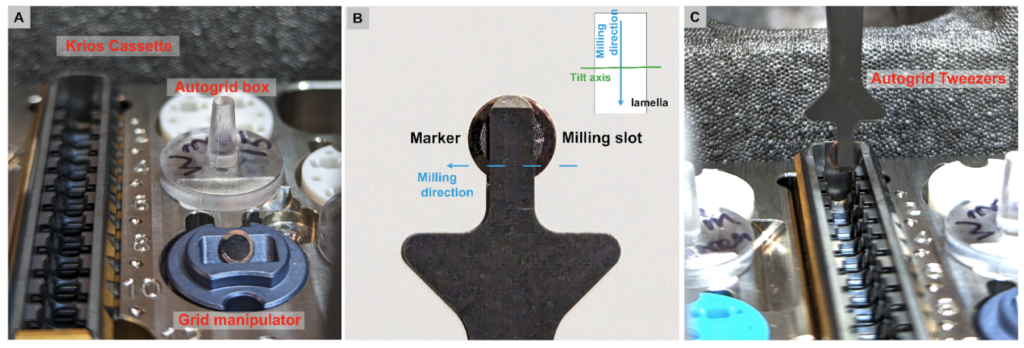
The milling angle for each lamella is known and can be obtained from the FIB/SEM associated software, e.g. AutoTEM or Maps, for accurate tilt-series collection, so that only the direction of how the lamella is tilted needs to be determined in the microscope. There are three methods to reliably determine the correct stage pre-tilt angle (positive or negative) to orient the lamella surface perpendicular to the electron beam under the TEM. The stage pre-tilt angle is dependent on the specific milling angle per each lamella. However, the direction of the necessary stage tilt in the TEM only needs to be determined once per grid.
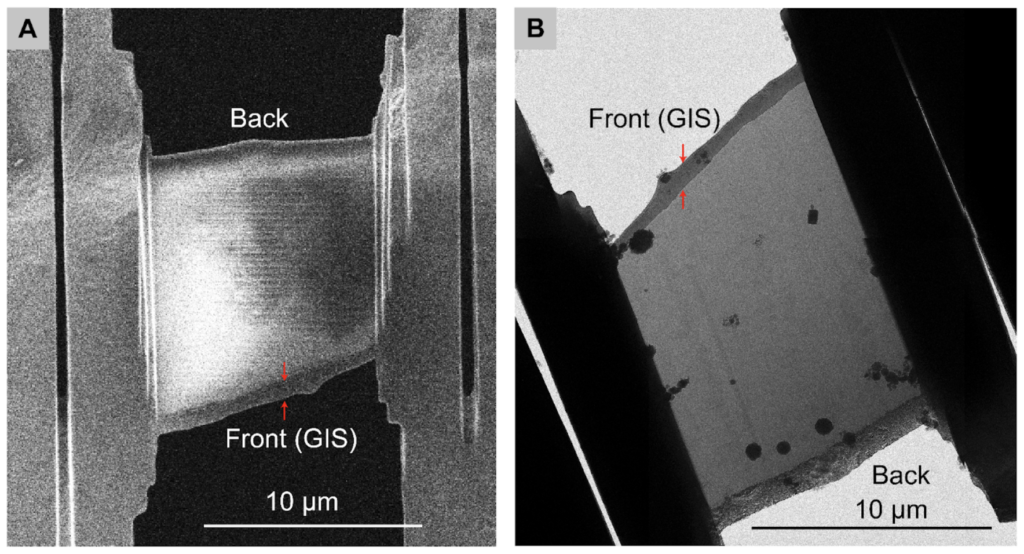
This is done by centering on a lamella and tilting 30 degrees in both directions and taking a snapshot at each tilt. The side of the lamella that appears shorter and darker when comparing the two snapshots is the side of the lamella that is above 0 degrees, the other lies below. Now the pre-tilt can be set, so that the collection starts with a flat lamella to ensure the thinnest ice and the data-collection can begin.
Method 1: Use the location of the GIS platinum layers to determine the lamella orientation by comparing images taken in the SEM and TEM. The milling angle is known to be 8°.
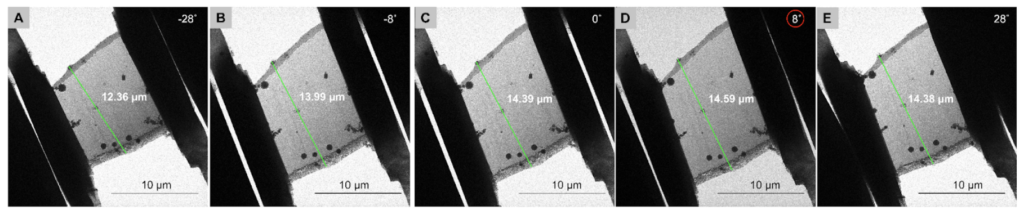
Method 2: Use lamella length at low and high tilts to identify directionality.
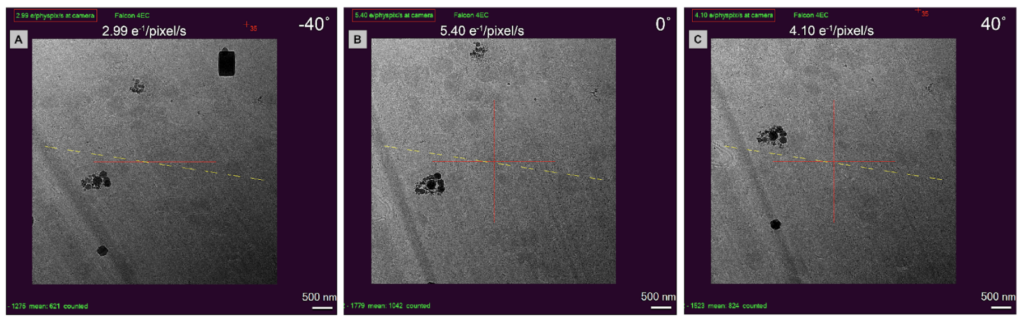
Method 3: Use energy filtered detectors to determine the thickness of the lamella as a function of the electron dose collected at the camera. The higher the dose, the thinner the lamella.
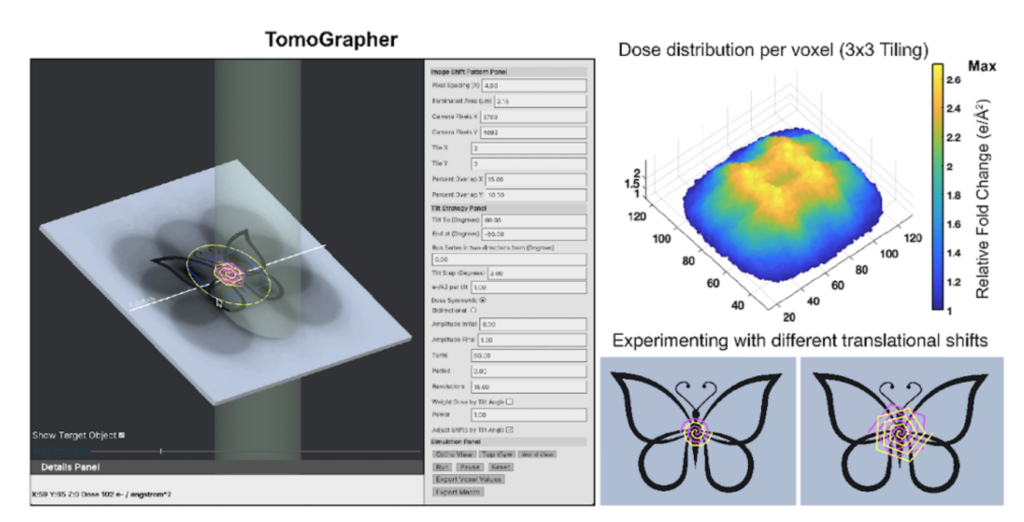
Due to the radiation sensitivity of frozen-hydrated samples, it has been challenging to collect cryogenic tilt-series preserving both high-resolution structural information and overall landscape. Parallel Array Montage Cryo-Tomography (MPACT) offers an approach to obtain 3D tomograms of larger fields of view without sacrificing resolution. MPACT applies a beam-image-shift montage acquisition via parallel illumination to acquire overlapping regular array tile patterns of an ROI.
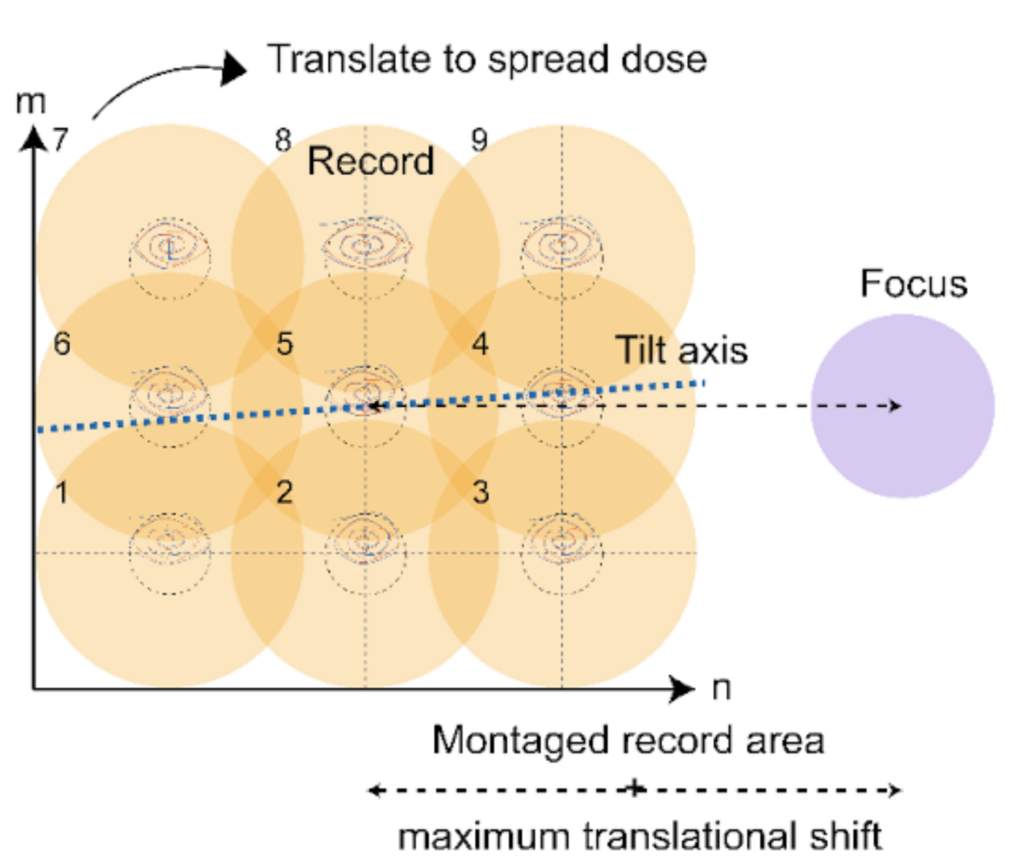
By shifting the center of the regular array pattern at each tilt moderately, the excessive dose accumulated in the overlap zones between two adjacent tiles gets distributed across the tilt series collection. Afterwards, stitching together the tiles collected at a higher magnification at each tilt generates a montaged cryo-tilt series. To quantitatively assess dose accumulation during MPACT and optimize cryo-ET collection strategies in general, TomoGrapher, a user-friendly simulation tool, can be employed independently or along with MPACT data acquisition, to visualize tilt series collection routines and determine global and local electron dose accumulation per voxel.
Another distinct advantage of MPACT is to enable expandable regular array montage pattern collection, rectangular or square, to be processed in their entity (montaged), and to generate individually processable tile tilt-series. This approach is able to provide a larger field of view without losing resolution.
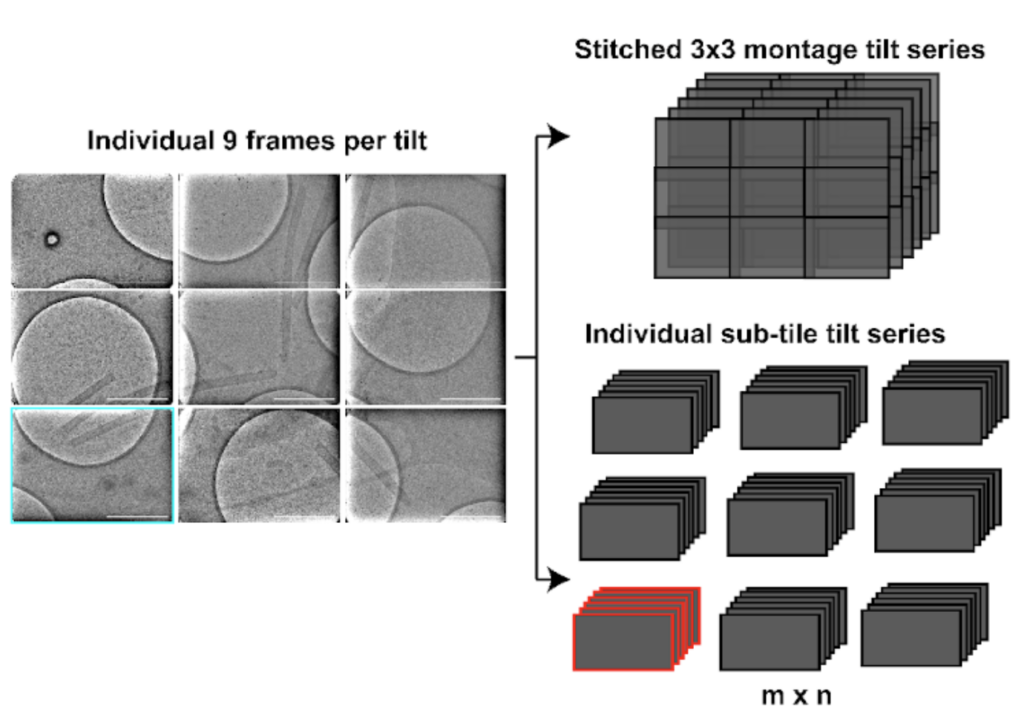
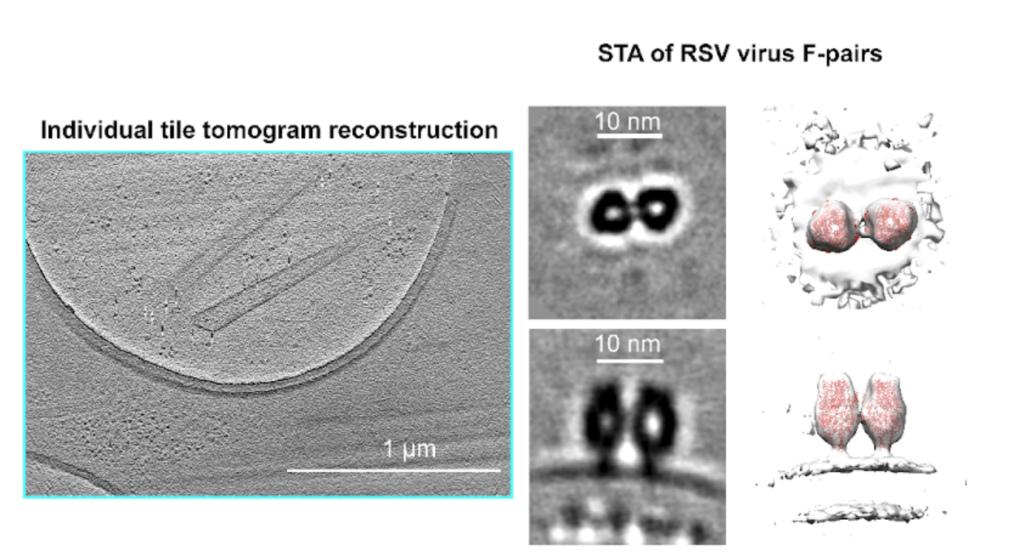
These individual tile tilt-series are suitable for subtomogram averaging (STA), producing reasonable in-situ structures of 20 Å at a raw pixel size of 4.6 Å. The MPACT workflow supports regular batch acquisition set up in SerialEM, allowing for a streamlined pre-processing pipeline with minimal manual interventions for montage stitching and tile sorting.
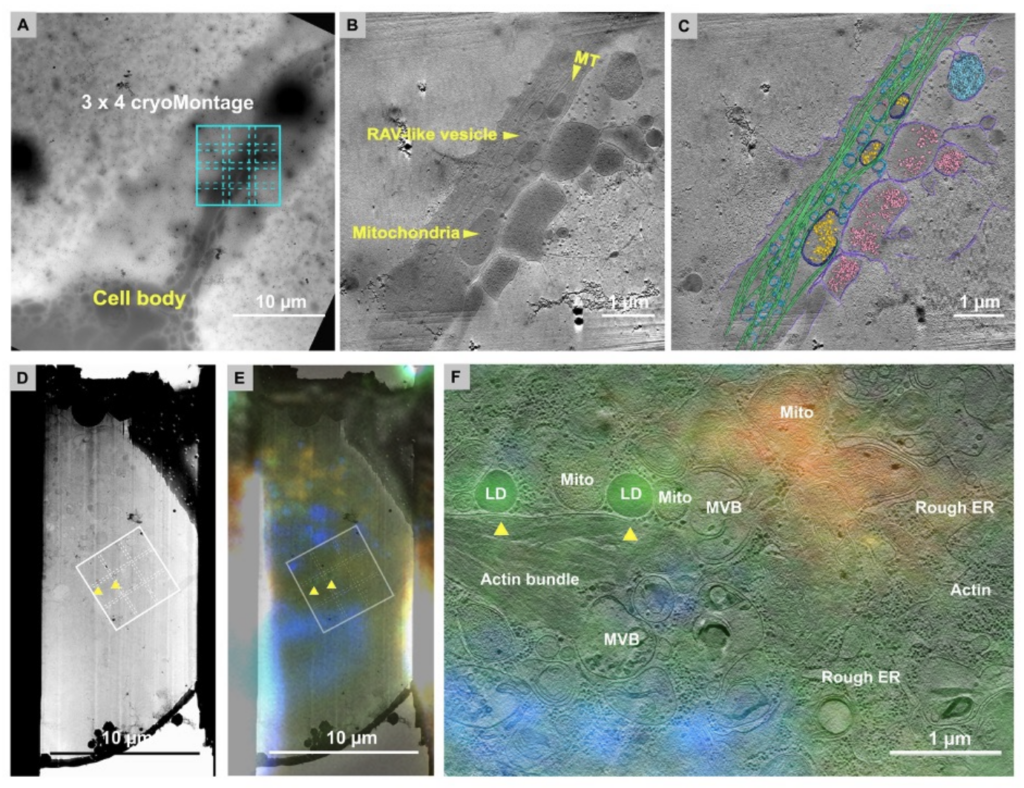
In combination with 2D and 3D correlative cryo-CLEM and cryo-FIB routines, MPACT provides insights into the cellular structures such as cytoskeleton organization of primary Drosophila melanogaster neurons on micropattern grids, and around Lipid-droplet-mitochondria rich regions.
Overall, MPACT integrates with existing advanced workflows well with fewer concerns over hardware implementation and cryo-ET data management. The acquisition setup in SerialEM, preprocessing, and detailed tutorials on the MPACT scheme can be found on the Github site.
Cryo-ET data collection frequently requires iterative trial-and-error experimentation to achieve high-quality results. The considerations of dose, magnification, defocus, tilt-series scheme, tilt-ranges and increments need to be customized for each individual sample. It is important to keep in mind to do what is appropriate for the sample and keep the question in mind and adjust parameters accordingly. Large cellular structures will need a different approach to an in situ structural biology project. We want to also raise awareness of the availability of the national CryoET Centers in the US or EMBL imaging centers in Europe where users can apply for time and training which will support them in seeing their projects through.
Once tilt-series have been collected, the next step is to process the data and obtain a reconstructed 3D volume, the tomogram.
© Copyright 2024