

Before embarking on a cryo-ET project and prior to collecting tilt-series, it is crucial to the success of the project to prepare the most suitable sample that is thoroughly vitrified and sufficiently thin for the electron beam to penetrate. Ideal samples will provide a 3D map revealing features of biological significance and/or for structural analysis. The unique strength of the diversity of biological samples accessible through cryo-ET comes with a challenge, since the sample preparation steps need to be tailored individually to each project.
In this chapter we focus on sample grid preparation and the major considerations and decisions one has to make to prepare a good starting sample. The modules are organized along the workflow to cover first the similarities to single particle workflows, such as for specimens involving viruses, virus-like particles (VLPs), or purified complexes. Additionally, we will cover common electron microscopy grid types used in cryo-ET, and other pre-freezing considerations such as fluorescent-tagging, micro-patterning, and inclusion of fiducial markers. The end of the chapter will summarize common freezing techniques and their applications.
Please be aware that although one can always select an approach involving the most techniques, instrument time and cost need to be taken into account and might not be the most appropriate path forward. This chapter should help to make informed decisions about the sample preparation and vitrification process.
Cryo-ET and cryo-EM share many commonalities, the most important of which is that frozen-hydrated specimens are imaged in their near-native states. Single-particle projects typically rely on having purified proteins or protein complexes as a starting point. In contrast, cryo-ET applications are used for a much broader range of specimens, from purified proteins to whole cells.
The type of workflow used is decided based on the goal of the project. In general, single-particle projects aim to achieve high-resolution reconstructions that are used for building atomic models. Cryo-ET projects can also achieve high-resolution reconstructions of purified materials, but it is more commonly used for imaging samples at the cellular or subcellular level. Specific details about single particle workflows are available on CryoEM 101, but more specific comparisons about the similarities and differences of the major steps in cryo-EM and cryo-ET are summarized below.
Sample and grid preparation: Samples for cryo-EM or cryo-ET need to be adsorbed onto a TEM grid. Cryo-EM and cryo-ET use identical grid preparation procedures for purified samples: a few microliters of sample are applied to the surface of a glow-discharged grid. After the sample is applied, the grid is blotted to remove excess liquid and then plunge frozen into a cryogen such as liquid ethane.
Exceptions to this procedure arise when preparing adherent cells for cryo-ET projects. Adherent cells are grown directly on gold grids (copper is not used due to cytotoxicity). Grids are then blotted only from the back side to prevent damaging the cells. For thick specimens, an extra step of focused ion beam-milling (FIB-milling) may be used to create thinned sections throughout the grid for imaging.
Data collection: Specimens are loaded onto the TEM stage and recorded using low-dose methods. For thicker specimens that are more commonly used in cryo-ET, image recording with an energy filter is often necessary to increase image contrast. Single-particle data are recorded by recording single exposures over each area, whereas cryo-ET tilt-series are recorded by recording multiple exposures over a single area at various tilt angles. Consequently, each cryo-ET tilt-series typically requires a higher total of electron beam exposure compared to single particle cryo-EM movies.
Data processing: Cryo-EM and cryo-ET data are typically recorded as movies. Movie frames are aligned to correct for beam-induced motion and then summed into a single image. From there, the data processing workflow diverges completely. In single-particle projects, particle images are extracted from micrographs and then used for downstream 2D classification and 3D reconstruction. In cryo-ET, summed images in a tilt-series are aligned to each other to generate a tomogram that is used for downstream processing.
Fiducial markers are used to aid tilt-series alignment, since they are of high contrast and embedded in the ice, and also for accurate correlation between fluorescent light, SEM and TEM images. Protein coated gold nanoparticles are most commonly used in cryo-ET applications and are added to the sample prior freezing to embed the beads into the ice. These beads can be used during tilt-series alignment to correct for x,y-shifts to produce high-resolution 3D reconstructions.
Tilt-series (left) and corresponding tomogram (right) of a Bdellovibrio cell. 10 nm gold beads coated with BSA were used as fiducial markers. Note the clear contrast of the fiducial markers in the tilt-series and the tomogram. White ‘flags’ surrounding the markers in the tomogram are caused by the missing wedge (the sample can only be tilted within a certain range omitting high tilt angles). Videos by Yi-Wei Chang, Grant Jenson laboratory.
However, a limitation of fiducial markers is that they seldomly can enter cells or tissues and sometimes locate to air-water interfaces. This is a problem because the air-water interface and markers may become removed through FIB milling or sectioning and the information is no longer available for tilt-series alignment calculations. This can be mitigated by employing alignment software that does not depend on fiducial markers.
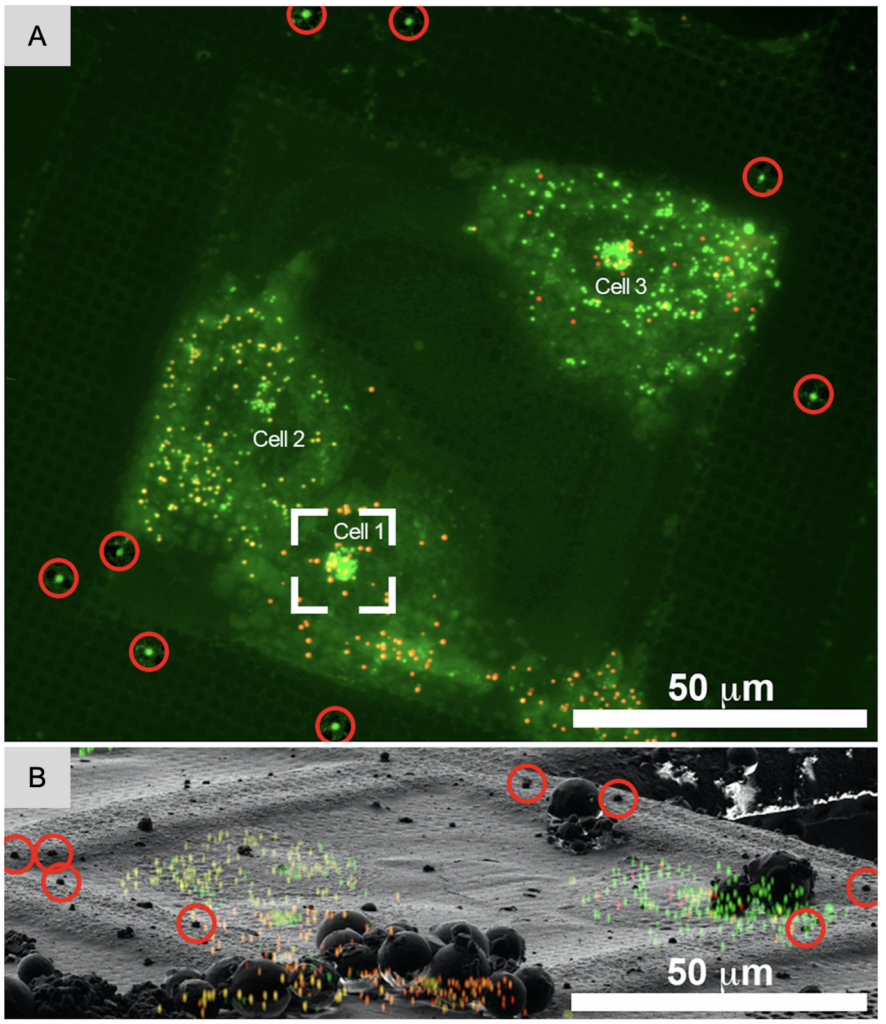
Nanoparticles can also be labeled with fluorescent dyes, or alternatively, fluorescent quantum dots can be used as fluorescent fiducial markers to serve as landmarks to correlate fluorescent images with SEM and/or TEM images. Genetically encoded fluorescent dyes on proteins are inherently weaker and not electron dense, so presence of fluorescent nanoparticles or quantum dots provides a strikingly obvious signal. Identifying a correct Z-height for the region of interest is crucial, especially when the sample is thinned using a focused ion beam (see Chapter 3). Fluorescent nanobeads can be used to extrapolate the location of the protein fluorescent signal to better place the section to be retained during milling. The fluorescent signal is quenched by the electron beam, so the fluorescent image will always need to be taken prior to the tilt-series collection. However, new developments of more stable nanoparticles (e.g. https://doi.org/10.1111/jmi.12778) could overcome these challenges in the future.
In cryo-ET, most projects are focused on a specific region or macromolecular complex inside a cell which is likely not abundant. Substantial screening of snapshots and data processing efforts would be needed to identify images and tomograms with relevant information. However, access to high-end microscopes is limited and costly. Similarly, data processing is computationally and time intensive. These issues can be mitigated on the sample level by labeling organelles or specific proteins fluorescently to identify relevant regions on the grid for tilt-series collection.
Fluorescent labels can be included as genetically encoded labels like mCherry and GFP, or self-labeling protein tags like Snap- and Halo-tags to tether smaller fluorescent dyes like Alexa dyes. In a different approach, organelles can be labeled (e.g. mitochondria) or even lipid droplets. Most importantly, these modifications need to occur prior to freezing of the specimen: it is important to recognize that once the specimens are frozen, no changes can be made.
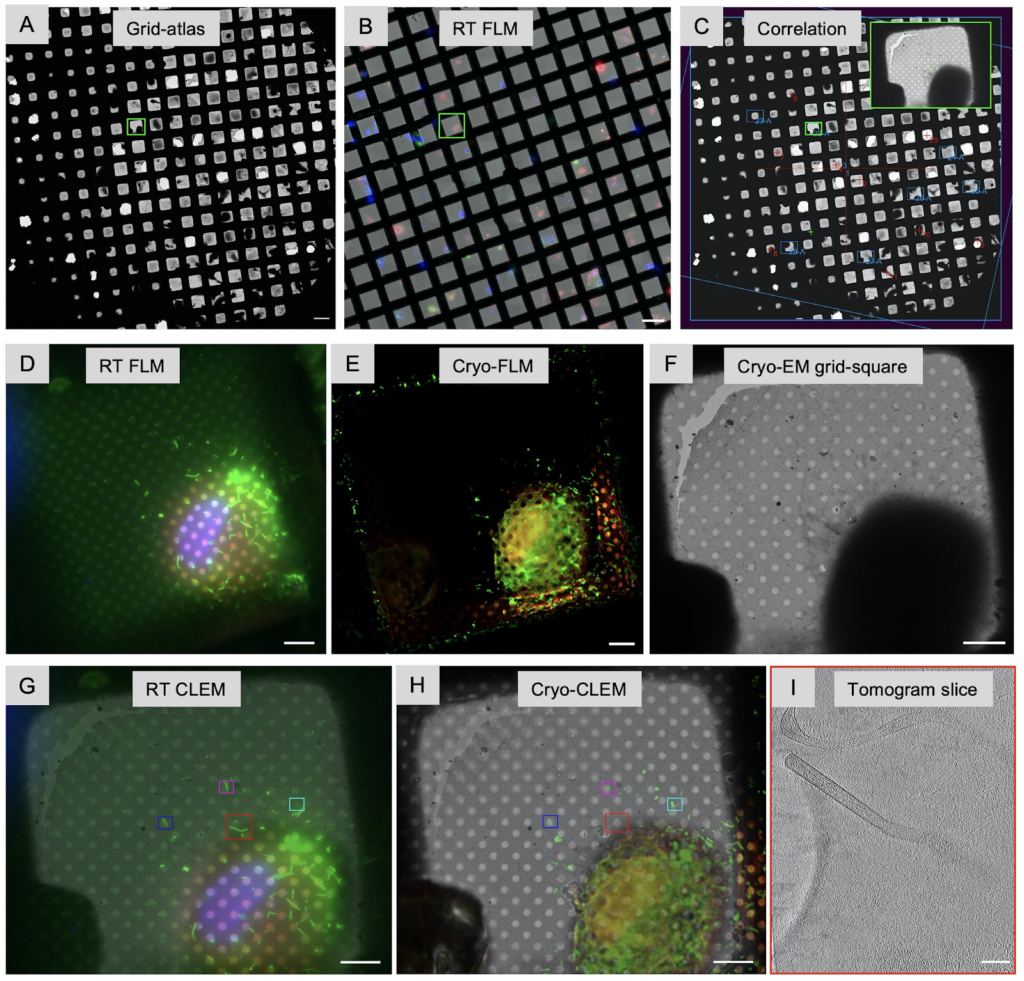
In addition to identifying regions of interest to image, the fluorescent label can also be used to correlate the final 3D reconstruction, the tomogram, to the area of the cell it was taken from providing cellular context. This workflow is referred to as Correlated Light and Electron Microscopy (CLEM). The fluorescent imaging can either take place prior vitrification (CLEM), after vitrification (cryo-CLEM) and sometimes both. Correlation between vitrified sample and tomogram is superior since the fluorescent images are taken directly from the vitrified samples and no changes can occur between imaging and freezing which one needs to take into account for RT CLEM. A dedicated upright fluorescent light microscope outfitted with a cryogenic stage and objectives that can be used at cryogenic temperature is crucial to image vitrified samples. Recently, Focused Ion beam (FIB) instruments which are used to produce thin lamella (Chapter 3) can be outfitted with fluorescent light microscope capabilities. The advantage is that ice contamination is minimized; however, the distance between the stage and objective is fixed allowing only for one magnification which may bring additional challenges if higher magnifications are needed. The developments in this field are rapid: some solutions offer confocal cryo-light microscopes amplifying signal strength, cameras with improved quantum efficiency with the ability to provide Z-stacks, and more magnifications (20x, 50x and 100x) to choose from for integrated fluorescent imaging within FIB instruments.
Another challenge is introduced through autofluorescence at cryogenic temperatures which is stronger and may interfere with lower signals. Especially when working with cells, this can be alleviated by using special tissue culture medium for low fluorescent background. In addition, the desired macromolecular complexes may not be sufficiently bright if their copy numbers are low, in which case nearby structures may need to be labeled as well. Another approach is to incorporate newly developed fluorescent dyes like ‘super GFP’ to increase the signals. Development of cryogenic super-resolution fluorescent labels will be an important asset for cryo-CLEM approaches but are currently presented with technical challenges (reviewed in: 10.1146/annurev-physchem-090319-051546).
For further details please also refer to Prof. Elizabeth Wright and her team’s three part cryo-CLEM webinar series: “Advancing Cell Biology with Correlative Cryo-Microscopy including a hands on tutorial.”
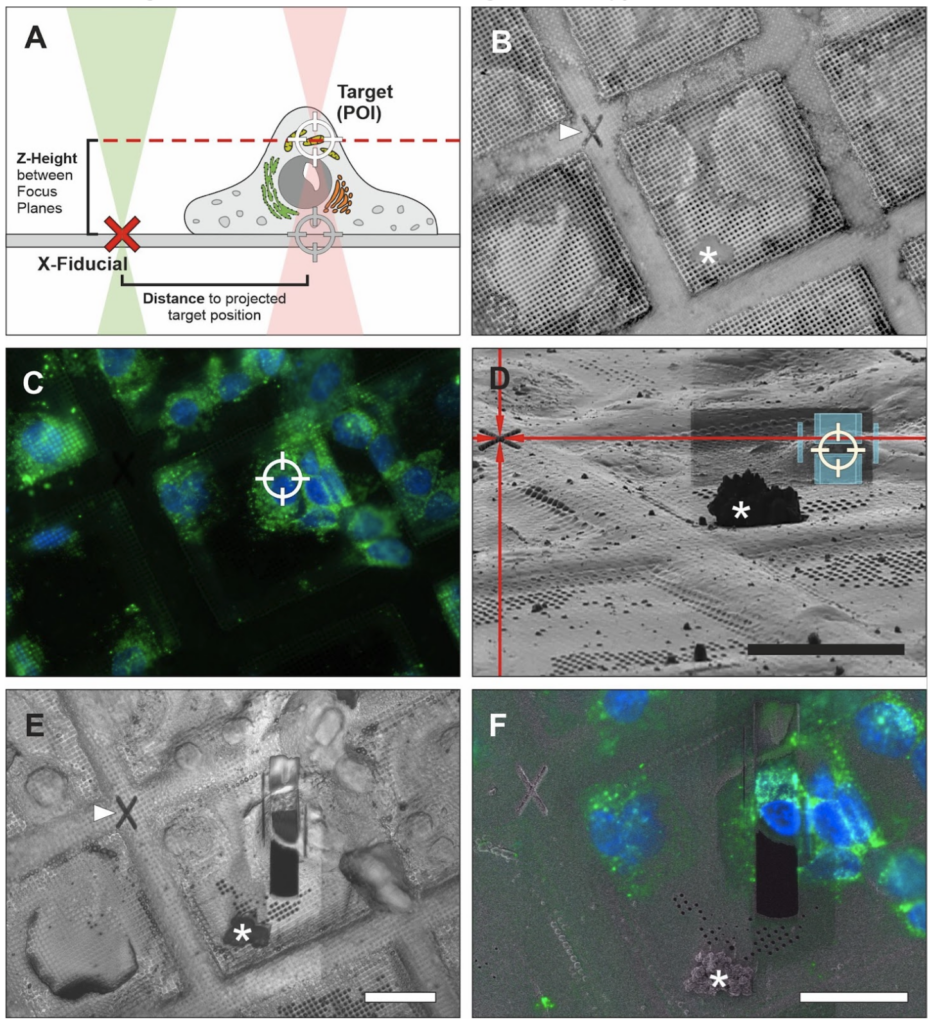
While fiducial markers often are thought of as beads or specific objects included in the sample, they can also be recognizable patterns on EM grids. In a new approach, once a region of interest is identified in the FIB-instrument using integrated fluorescence, “X” shaped markers (“X-fiducials”) can be etched into grid bars in close proximity to the target – which is done prior to coating with platinum. Identifying the correct z-height poses still a challenge and introduces the largest margin of error when deciding where to place a lamella and often regions of interest are milled away. X-fiducials serve two important functions: (1) unambiguous identification of the region of interest during the screening process to determine where a lamella is desired to be milled, and (2) aid with z-height determination to place the milling box to include the region of interest. Another advantage of the X-fiducial markers is that they are easily recognizable in the SEM view and the reflected light view, which reduces screening time at the instrument. Conventional fiducial beads are embedded in the ice and are less recognizable in SEM images (especially in thicker ice). This would require switching back and forth between fluorescence and SEM view, which prolongs screening time at the instrument and might be less accurate due to stage shifts. Therefore, use of X-fiducials may provide better targeting opportunities to produce more reliably lamellae including the region of interest.
The grid forms the foundation of a successful cryo-ET experiment. When working with whole cells and large specimens for tomography applications, various grid properties including mesh sizes, grid types, types of support layer, and materials of the mesh need to be considered.
Grid type. Grids commonly used for single particle approaches can also be used to vitrify purified samples and macromolecular complexes for cryo-ET. These grids typically have copper grid bars that form a mesh and pose as a scaffold with a carbon or gold substrate with evenly spaced holes (Quantifoils and C-flat grids) layered above. Vesicles, organelles, microorganisms, and long fibrils sometimes rather locate to the support layer with only little specimens located in the holes. These cases benefit from increasing the hole-to-substrate ratio which can be easily accomplished by using lacey carbon or lacey gold substrates. The lace provides a large imageable area in comparison to holey grids composed of evenly spaced holes and more prominent presence of support layers.
To grow cells on grids for cryo-ET, support layers made out of gold (most popular), titanium or nickel need to be used, since copper is cytotoxic. Carbon, gold and silicon oxide can replace copper when cells are cultured directly on grids. Notably, lacey carbon grids are not favorable in whole cell context because they do not provide sufficient support for cells to favor growing on these substrates. Most commonly, holey carbon grids with R 4/1, R2/1, or R 2/2 spacing are used . The holes are 4 µm or 2 µm in diameter (first number) with either 1 µm or 2 µm diameter spacing in between (second number). Regions of interest can easily be imaged at hole locations or through the thin carbon (DOI: 10.3791/62992). When thin lamellae are created through FIB-milling, the support film is completely removed in the process.
Mesh sizes. Mesh size is an important parameter for cryo-ET. Mesh sizes are inversely proportional to the surface area of each square. When the mesh sizes are large, each square will provide a smaller surface area. Conversely, smaller mesh sizes correlate with large squares. Since grid-bars are of a fixed depth (~35 µm) they will migrate into view if data collection occurs too close to the grid bars. Therefore, the larger the imageable area available per square is, the less likely it is to have parts of the tilt-series lost due to impenetrable grid bars in view. However, there is a trade-off. Grids with larger mesh sizes like 300 and even more so 200 are more fragile and require careful handling since the carbon layer is not as well supported.
Regions of interest need to be positioned ideally for data collection. Suspension cells have the benefits that they can be applied fairly highly concentrated on the grid prior to plunge freezing. When adherent cells are required, for example when macromolecular assemblies need the physiological environment to form and be stable, positioning cells optimally on the grid is more cumbersome. Adherent cells often prefer growing on grid bars since they are more rigid than the support layers, or sometimes they simply do not adhere to cryo-EM grids. To overcome these challenges, a maskless photopatterning technique has been adapted to be able to create patterns on the centers of cryo-EM grids, which create a reproducible environment, and increase the likelihood of cells to settle in ideal positions for in situ imaging.
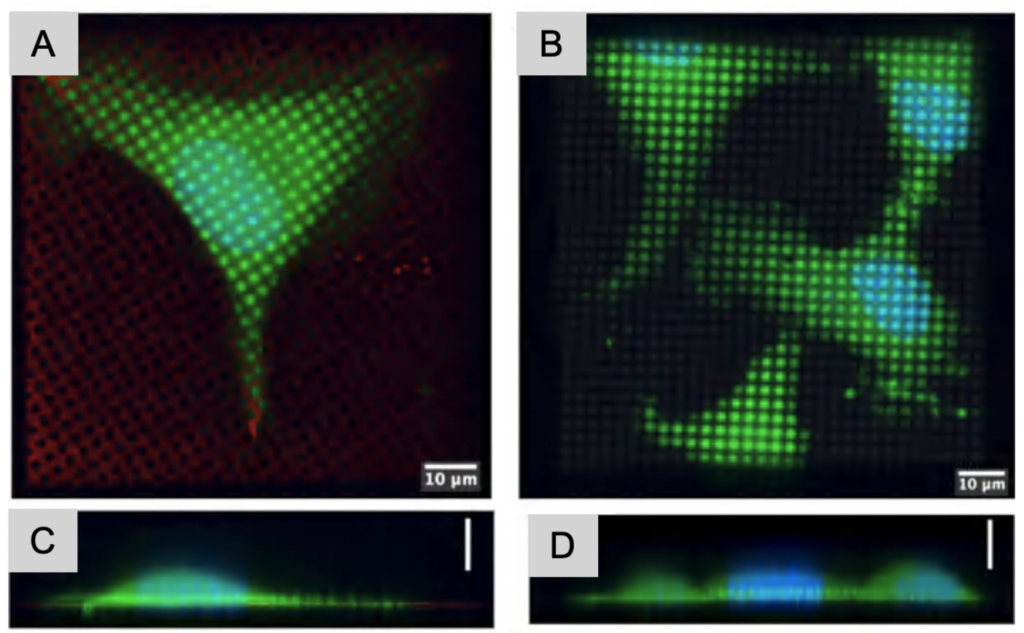
The patterns can be adapted to match the cell shape needed for the most physiologically relevant experimental design. The patterns are created on grid squares and the exposed surfaces are covered in proteins such as fibrinogen to promote cell adherence. These proteins can be tailored to specific cell types as necessary. Another advantage of micropatterning is the versatility of patterns possible: the patterns can be customized in shape and size, and protein gradients can be created as well.
For more information and detailed protocols we refer the reader to the CLEM youtube series created by Dr. Elizabeth Wright’s group (https://www.youtube.com/watch?v=VRjZB_FYMUc), their published protocol (10.3791/62992). A micropatterning protocol using PLPP gel can be found here (https://brasch.biochem.utah.edu/publications).
Vitrification is needed to preserve unstained, unfixed biological samples in an amorphous, glass-like state of ice closely similar to that of liquid water. The thickness of the samples determines the method required for freezing. Plunge freezing can be used to flash freeze samples that are less than 10 µm thick. During plunge freezing – either using a manual plunge freezer or a semi-automated device (e.g. Vitrobot, Leica GP2, Gatan CP3, etc.) – excess liquid is blotted away, leaving only a thin film of liquid. The grid is plunged into liquid ethane (see Chapter 2 CryoEM 101) and the samples are so rapidly frozen that water molecules are prevented from reorganization into ice crystals. This technique is appropriate for purified protein complexes, organelles, viruses, VLPs, microcells, yeasts, cell growing in suspension, neurons, and other thin mammalian cells grown on grids. Neurons and other eukaryotic cells can be seeded on coated or micropatterned grids. However, for mammalian cells, yeasts, and similar specimens, an additional consideration has to be made. The excess liquid should be removed from the backside of the grid to avoid touching and likely removing the samples with the filter paper and, in addition, to avoid ‘squishing’ of the samples during blotting, which might impact biological structures.
For thicker samples above 10 µm, the cooling process is too slow and crystalline ice is likely to form during plunge freezing. Water molecules adopt ordered lattices in crystalline ice, which expands the aqueous component of the sample and can destroy the native sample in the process. High pressure freezing (HPF) is the preferred choice for samples up to 200 µm. During this process for which specific equipment is needed, high pressure is applied during freezing with nitrogen counteracting the formation of crystalline ice to prevent expansion of the sample. The application of pressure shifts the phase diagram and increases the heat capacity of nitrogen. This technique allows access to deeper cellular structures, tissues or whole animals like C. elegans.
However, samples frozen into a glass-like ‘ice puck’ are not amenable to FIB-milling, the current method of choice to prepare thin lamellae for data collection, since they are too thick and don’t have an electron microscopy grid as a support medium. Without using a fluorescence signal it is challenging to identify the location of the sample within the frozen disc. This is an area of rapid method development. One approach to overcome these hurdles and gain access to eukaryotic tissues for imaging are cryo-FIB lift out techniques, where a slice of the sample is extracted and attached to another grid to then be imaged (https://doi.org/10.1111/jmi.12953, https://doi.org/10.1038/s41592-019-0497-5). In parallel, adaptation of plunge freezing enables vitrification of thicker tissues. Bäuerlein and colleagues (2021) successfully used glycerol as a cryo-protectant on dissected drosophila tissues to substantially increase the vitrification depth of the sample (https://doi.org/10.1101/2021.04.14.437159). For example, 15 µm nerves and, remarkably, the periphery of 200 µm thick drosophila tissue were perfectly preserved. The tissues were readily identifiable on EM grids in FIB-SEM instruments due to their size.
HPF is a fantastic technique for thicker samples and it will be exciting to see the method become increasingly more integrated with cryo-ET workflows in the future.
The “Waffle method” is an alternative method to increase sample quantity on grids and broadens FIB-milling for in vitro and in situ applications. Samples are deposited onto EM grids, followed by high pressure freezing (instead of plunge freezing). The advantage of HPF as a vitrification method opens up samples of larger thicknesses than conventional plunge freezing, while the sample remains amenable to FIB-milling. The method particularly helps with preferred orientation issues on cellular and particle level. Due to saturation of the grid with sample, throughput is remarkably increased, since the need of screening of the grid to identified regions of interest is nearly eliminated as each square becomes saturated with sample containing ample regions of interest. This method is very useful for particles that have low copy number, cells that do not attach well to EM grids, cells with preferred orientation, and even for single particle approaches when particles are located predominantly at the air water interface.
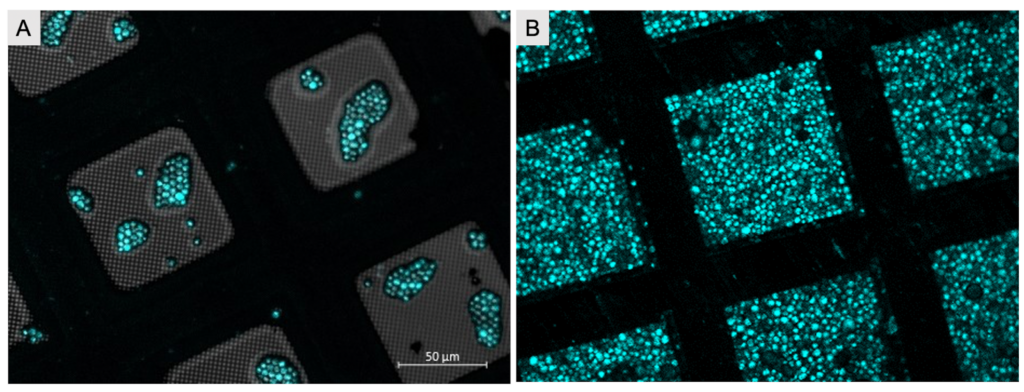
At its most basic, the grid is flipped with the grid-bars facing up and the support layer facing down. The sample is highly concentrated and deposited into grid-squares – as if filling up a waffle with syrup – hence the name “Waffle method”. This method has taken the cryo-ET field by storm and quickly established itself as a routine procedure in labs and national centers. This chapter features the sample preparation and vitrification part of the method, while the unique FIB-milling approach will be featured in the next chapter (Chapter 3).
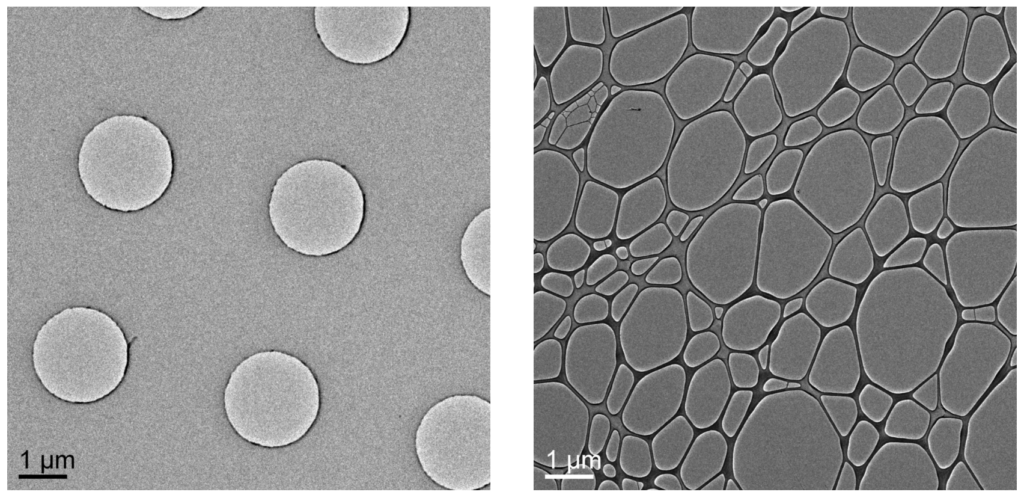
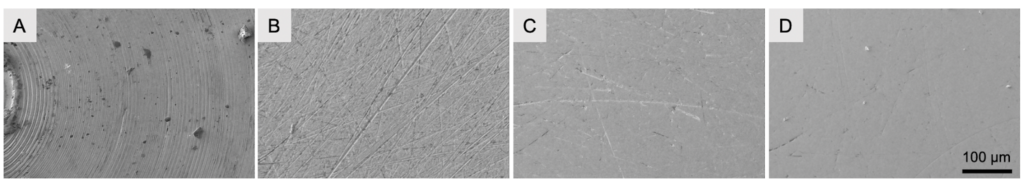
To create a vitrified waffle sample, the sample is filled into the grid and then high pressure frozen between two HPF planchettes. Prior to being able to use the planchettes, their surfaces need to be polished to remove concentric circles remnants from the manufacturing process.
Subsequently the sample waffle can be created, vitrified using high pressure freezing, freed from the planchettes, and grids can be stored under liquid nitrogen until FIB-milling is used to create the thin lamella.
Overall, this freezing method can be used for many different sample types and allows to increase sample number and location. For further reading please refer to the article (https://www.nature.com/articles/s41467-022-29501-3) and detailed online protocol (10.21769/BioProtoc.4544).
The sample preparation process likely requires many different trials to obtain a perfectly vitrified sample for data collection. As outlined and described in this chapter, at each step there needs to be a decision between multiple methods. It is crucial to think thoroughly about and determine the path and combination of methods highlighted above that are most adequate to reach the goal: to be able to answer the research question. One should avoid the temptation of combining ‘all the schick methods’ because each requires data collection, processing and evaluation, which are not trivial. We advise you to try the simple path first to be more time- and cost-effective. Once the sample is prepared, tilt-series will be collected at an electron microscope (chapter 4). However, sometimes the sample is found to be too thick to be penetrated by the electron beam and the sample cannot be imaged directly but needs to be thinned. Methods to produce samples with appropriate thickness are covered in the following chapter (Chapter 3), including ultramicrotomy and focused ion beam milling (FIB-milling).
© Copyright 2024