After reconstruction of a tilt series into an information rich 3D volume ( Chapter 5; e.g., using the Imod suite), the information contained needs to be analyzed and presented to extract the maximum structural information from the data using tomogram segmentation and subtomogram averaging.
Reconstructed tomograms are often annotated to highlight gross cellular features, organelles, and massive molecular machines, especially, since 3D volume data commonly has high complexity with low signal-to-noise ratios and is difficult for the untrained eye to interpret. Biologically relevant features, for example macromolecular cellular structures like organelles or the cytoskeleton can be traced and turned into surface representations providing information about localization, arrangement allowing for detailed interpretations. If conformationally and compositionally identical macromolecules are ubiquitous in the tomogram, high resolution structural information of these molecules in their native biological environment can be achieved by averaging the individual subvolumes, or also referred to as ‘subtomograms’, a process called subtomogram averaging, which helps to overcome the anisotropy introduced by the missing wedge.
Tomograms of organelles, viruses and cellular environments benefit especially from annotation. The inside of cells are crowded, filled with proteins, different filaments and an abundance of different membranous structures which are often hard to interpret – especially for an untrained audience. Selection and surface representation of these volumes included in cellular tomograms, presents the data informatively and, in addition, can reveal new and surprising findings. Essentially, the segmentation of tomograms is a powerful step that transforms complex three-dimensional cellular volumes into interpretable biological information.
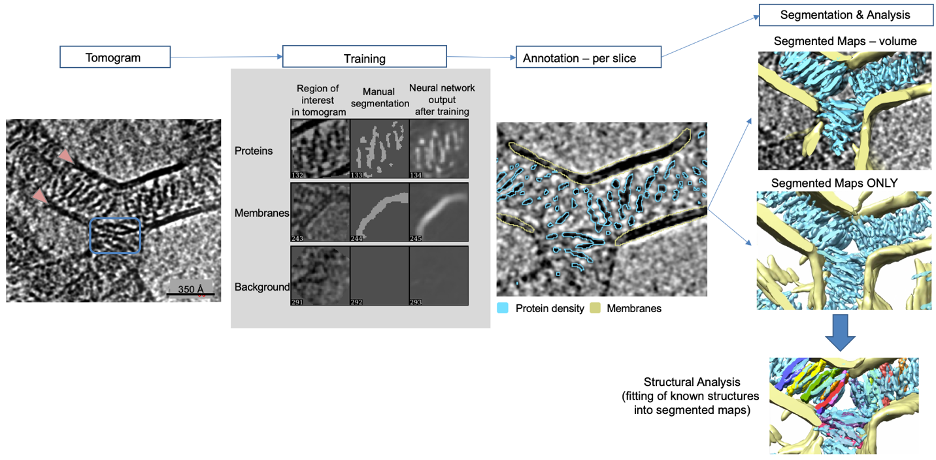
The selection of each feature can be done manual, semi-automated, or machine learning assisted. Commonly, automated segmentation is preferable, since it is more objective, reproducible, and time efficient. A common goal is to eventually share pre-trained networks, so that common features like actin filaments, microtubules, and membranes can be annotated automatically. Since the increase in quality of tilt series, refinement processes, and software development are going hand in hand, neural network algorithms have become more and more useful in tomogram annotation.Let’s look at a simple example to learn about the concept of tomogram annotation using a neural network. The tomogram (below) is challenging to interpret, which is a common issue in cryo-ET. Segmentation is used to highlight features in the tomogram for further analysis. The sample contained liposomes, circular lipid bilayers, coated with proteins that were facilitating contacts between liposomes. Membranes are usually quite easy to identify (see arrows below), since they are quite electron dense and stand out. However, the protein density is more challenging (see boxes below). In our example, a convolutional neural network was used to recognize different features in the tomogram: membranes and proteins (Chen et al. (2017)). First, a few example regions are manually traced in the tomogram that correspond to features of interest like proteins and membranes in this example. Importantly, the program is also taught to disregard undesired features such as noise, ice-contamination, and other artifacts, which is helpful to reduce identification of false positives. After the algorithm is properly trained and returns the proper output on a sample slice, each slice of the tomogram is automatically annotated. Once finished, the annotation should be checked slice by slice. In the example below, it is visible that the annotated cyan protein density is hugging the stick-like proteins and the yellow annotation overlays lipid bilayers. The annotations on each slice are combined computationally and produce a volume for each annotated feature. For clarity the tomogram can be removed and the annotated features further studied.
After understanding the concept of annotation and segmentation, we can take a look at an annotated tomogram of the cellular leading edge (below). The tomogram is inherently noisy and dense, it contains overlapping features from membranes, organelles, cytoskeletal filaments, and molecular complexes. 3D information, connectivity of filaments and membrane enveloped vesicles and other structures are hard to derive from this data. So, using the program Dragonfly to segment the tomogram, multiple features of the cell are annotated since it allows identification, classification and isolation of structural components within the tomogram of the cell. This ultimately turns noisy tomographic reconstructions into a navigable cellular map linking gross cellular features like organelles and cytoskeletal networks with molecular-scale details of large complexes. Please see Heebner et. al (2022) jove for a tutorial on how to use Dragonfly to generate this segmentation.
The spatial organization of cellular structures and macromolecular assemblies are now visualized in 3D, effectively bridging the gap between cell biology and molecular structure. For example, segmenting membranes (cyan), ribosomes (orange), macromolecules (magenta) or cytoskeletal filaments (green, red, blue) enables us to study how these elements are positioned relative to each other as well. This can reveal organizational principles such as membrane contact sites, protein production (ribosomes) and folding sites (TRIC, a large molecular chaperone protein complex in eukaryotic cells that helps other proteins fold correctly), cytoskeletal anchoring, connectivity and organization (actin, cofilactin, microtubules), or vesicle trafficking pathways (membranes).
In essence, segmentation links gross cellular features like organelles and cytoskeletal networks with molecular-scale details of large complexes. By integrating this information with complementary high-resolution data from single-particle cryo-EM, X-ray crystallography, or NMR, segmentation enables a multi-scale understanding of how molecular architecture supports cellular function. Ultimately, this approach allows researchers to connect structure to function directly inside the cell, providing an unparalleled window into the native organization of life at molecular resolution.
When individual protein complexes can be recognized and averaged, segmentation provides quantitative insights into molecular crowding, local concentrations, and conformational states within the cellular context.
*Section content contributed by Dr. Jessica Heebner.
As the throughput of electron microscopes continues to rise dramatically, the demands on image analysis tools are growing just as rapidly. While advances in data collection have accelerated, image analysis, particularly segmentation, remains a significant bottleneck across the field of cryo-ET.
Automated segmentation strategies powered by deep learning offer an exciting solution. These methods have already made it possible to perform image segmentation and analysis at scales that were previously unmanageable due to the time, expertise, and manual effort required. However, most current deep learning approaches still demand users to train their own neural networks or adapt existing models to new datasets. While platforms such as Napari, ImageJ, Amira 3D, and Dragonfly 3D have made these processes more accessible, they still require substantial technical knowledge, time to curate appropriate training datasets, and access to computational resources.
A major step forward would be the development of general-purpose convolutional neural networks (CNNs) that are pre-trained to segment commonly studied structures in cryo-ET data. With sufficient volumes of high-quality training data, such networks could achieve broad generalizability and reliable performance across diverse datasets. In the future, it is entirely plausible that cryo-ET workflows will include tools that can automatically detect and segment cellular components (such as membranes, ribosomes, and microtubules) immediately following reconstruction, requiring minimal user input.
This shift toward robust, generalizable segmentation tools has the potential to transform image analysis from a bottleneck into an integrated, largely automated step—dramatically accelerating biological discovery from cryo-ET data.
Subtomogram averaging enables us to obtain 3D information by combining subvolumes of reoccurring particles to look at proteins and macromolecules in their native environment, different states, and often aids identification of new co-factors. However, each object in the tomogram is not a perfect 3D reconstruction from the start, mainly because of anisotropy caused by lack of data due to the missing wedge problem (for more information please see Chapter 4), which is an intrinsic problem due to data collection limitations. These issues can be overcome if a tomographic reconstruction contains many identical structures, e.g. virus particles or if macromolecules are at higher abundance and easy to identify, e.g. ribosomes or TRIC, within cellular environments (see annotated tomogram above).
Overall, particles are identified and selected in the reconstructions using either manual picking, automated picking using template matching, picking relative to a support geometry, e.g. along microtubules, closely packed protein arrays or on membrane surfaces. These subvolumes containing the particles are excised, aligned to a simple reference representing the shape of the molecule without any features, and then averaged to obtain macromolecular structures from their native environment that can be analyzed in detail. This process is highly iterative and can eventually yield high-resolution (better than 3.5 Å) reconstructions if particles are abundant and symmetric.
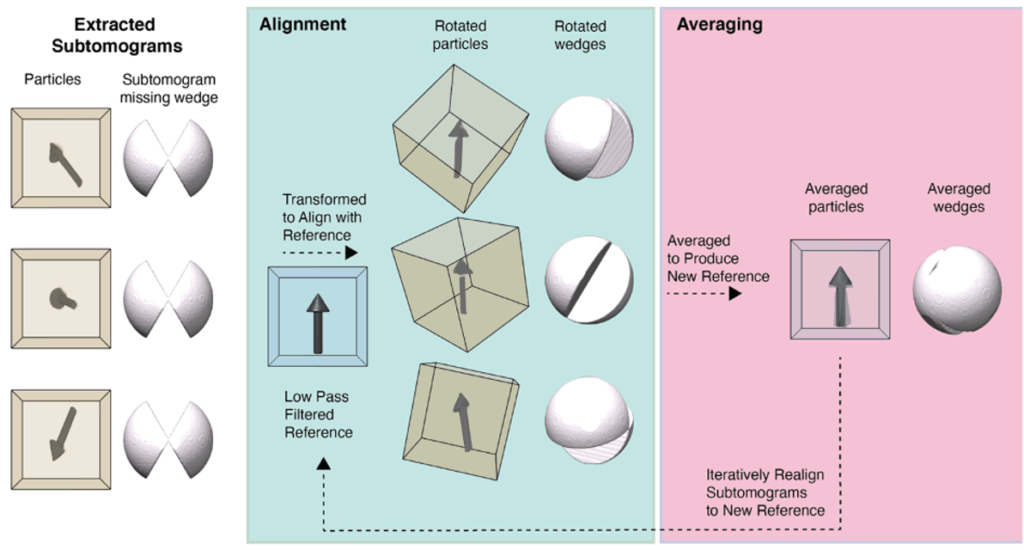
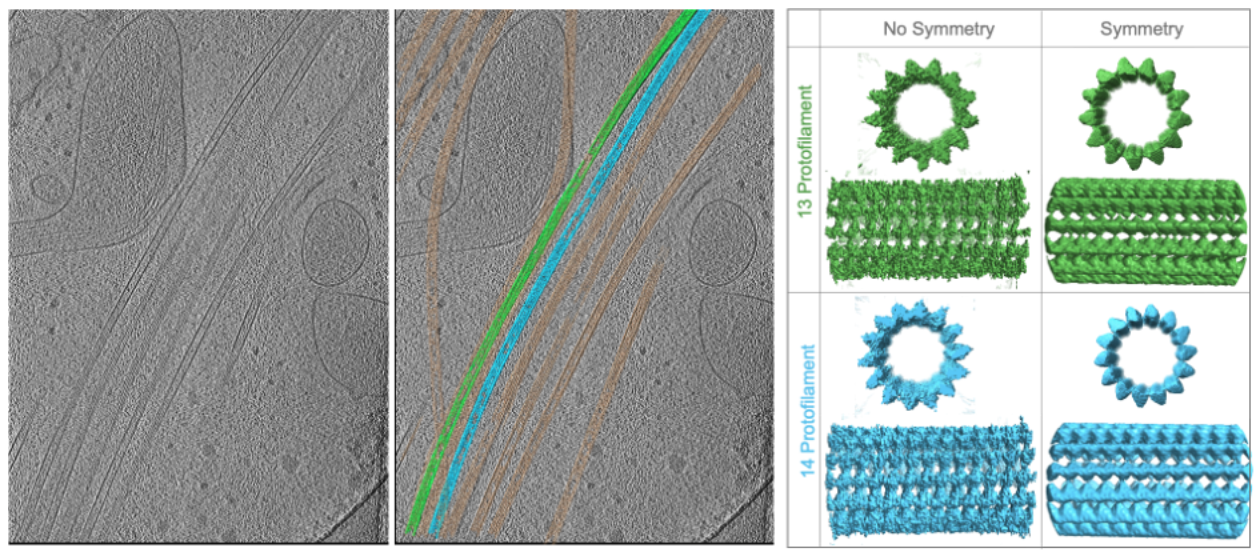
Since particles are likely oriented differently within the 3D volume, the missing wedge of each particle is filled in by the present data of another, which eventually cancels out the missing information if the subvolume number is sufficiently high. Resolution can be further improved if symmetry can be applied, since it further amplifies the signal.
Software suites for subtomogram averaging workflows are the focus of rapid development to streamline the processing workflows, user-friendliness, and improve compatibility. Big hurdles in the overall cryo-ET workflow are compatibility issues. Sometimes a tomogram generated with one software cannot be processed by certain segmentation or STA programs, which hopefully will become a minor concern in the future.
It can often be very helpful to include denoising steps (e.g., with Cryosamba) prior to segmentation and subtomogram averaging to boost contrast to aid annotation or particle picking steps without losing high-resolution information. Overall, commonly used suites for subtomogram averaging are Dynamo, Relion, Warp, Scipion, the EMAN2-suite, and TomoBEAR. To get started please see tutorials on subtomogram averaging workflows by team tomo here, using the Relion suite here, and the tomoguide here.
In combination, segmentation and subtomogram averaging allow for ‘visual proteomics’ to identify many different proteins within cells especially when the resolution of the tomogram is sufficiently high to discern distinct molecular shapes. Overall, the mechanistic details and information to be learned from structures obtained from proteins in native cellular context is going to provide impactful insights.
© Copyright 2024